Investigations
The Investigations brick is used to create and manage investigations associated with the project.
It can be accessed via the dedicated button on the taskbar: 
Database design
The Orbow geotechnical investigation database is built according to the nomenclature of the geotechnical data exchange file format AGS version 4.1.1, whose specifications, field and table names, and abbreviations are detailed in www.ags.org.uk/data-format/ags4-data-format.
When you get to this brick, you can see :
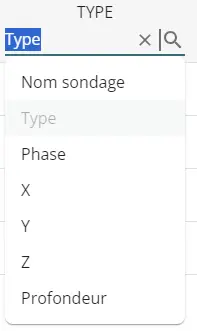
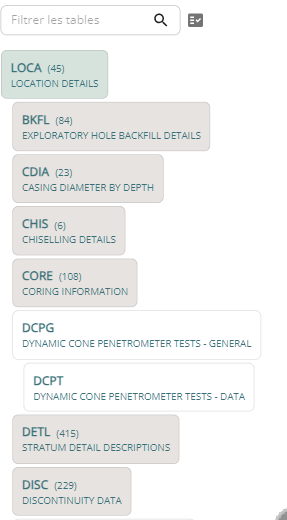
- a "list " tab: this tab lists all the investigation associated with the project and allows you to create, import and consult data using forms;
- a "tables " tab: table mode displays the tables in the database, following the AGS nomenclature.
You can also create, edit and import data into your project directly from this table mode, which resembles a MS Excel workbook with interrelated tabs. Some fields specific to Orbow appear in tables with the nomenclature table_orb_field_name.
Any data created in a form (from the 'list' tab) is visible in the tables accessible from the 'tables' tab.
Reciprocally, if you create/import data directly in table mode, the forms will display the associated data correctly.
Page listing the references
The main window shows the list of references for the project:
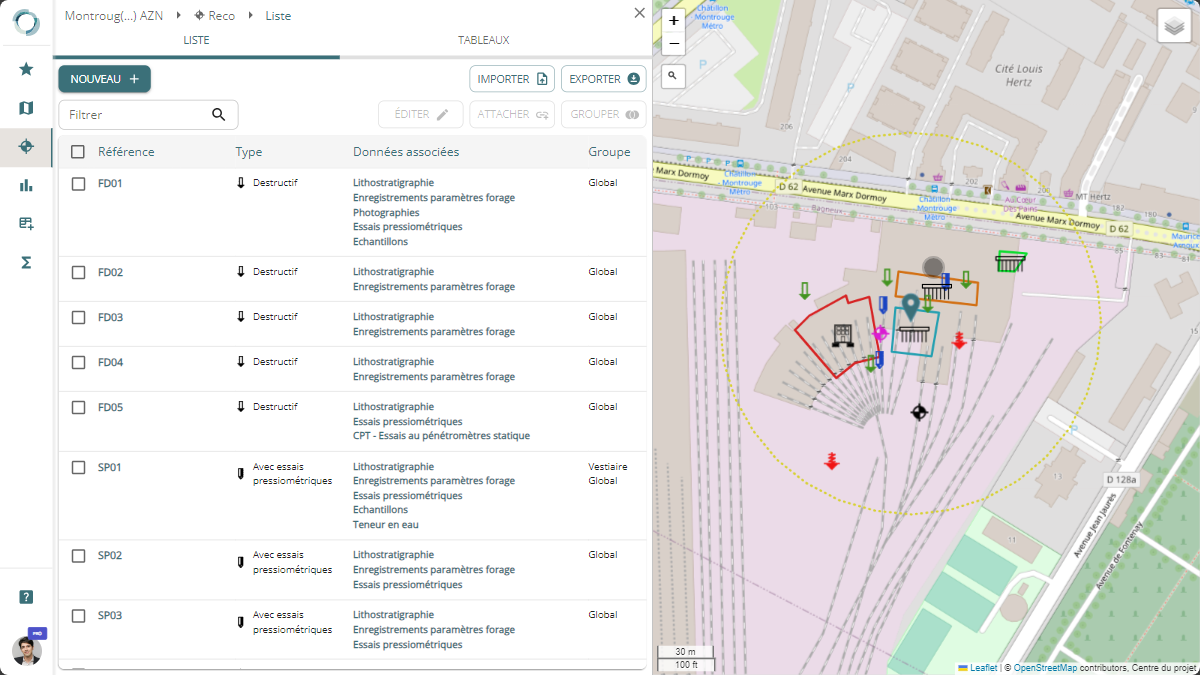
At this stage, the term "reference" is used because, in addition to Boreholes, geophysical profiles, instrumentation data, photographs and foundation data will also be included.
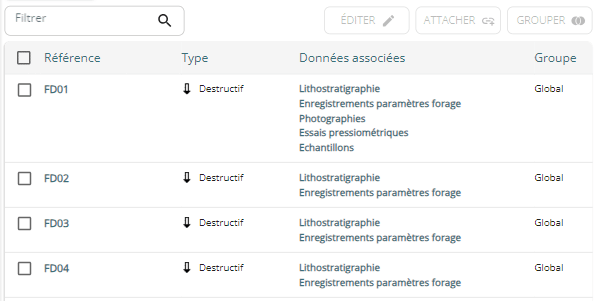
The page includes a table listing :
- all project references
- the type of reference
- the associated data
- the groups to which the reference belongs.
The names of the tests in the table are clickable, as are the test icons on the map.
The data associated with the references are also direct shortcuts to the pages containing this data.
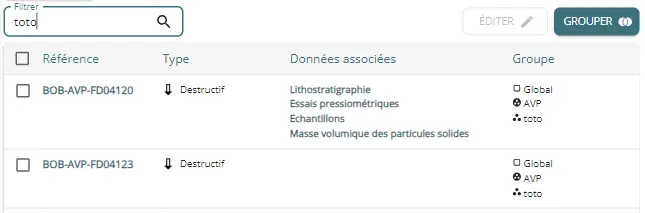
You can easily filter the list by combining character strings in the various columns with the * sign:
When you select one or more soundings from the list, they are marked and the selection is centered on the map on the right.
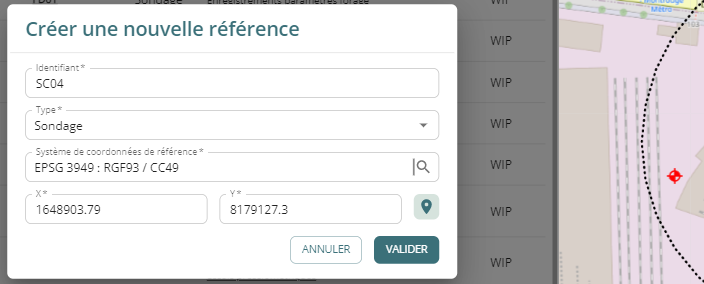
Create a borehole
Use the  button at the top of the window to create a poll.
This opens a creation panel which works in the same way as the project creation.
You need to enter :
- the identifier (name) of the test (32 characters maximum) ;
- select " Borehole " from the "Type" list (intended for creating other types of reference such as geophysical profiles, instruments, etc.);
- choose the reference coordinate system (the one used in your project by default);
- enter the coordinates of your borehole in the chosen system, or click and drop on the map using the "pin" button dedicated to this task.
Import a table of borehole location
The button :
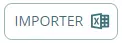 is a wizard for easy implementation of a survey batch.
Simply upload your file and match the following essential fields:
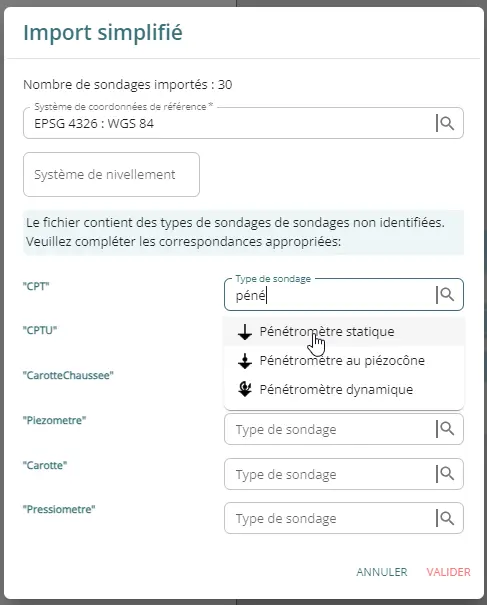
Click on "Verify" and if no problems are detected, you can specify the (unique) coordinate system of your survey batch, then match the different types that were detected in the column you declared as containing the type and the Orbow types.
You can use the table editor to import more pre-filled columns, see the dedicated tutorial.
Export survey list
You can export the survey list with groups and associated data via the button :

Import an AGS file
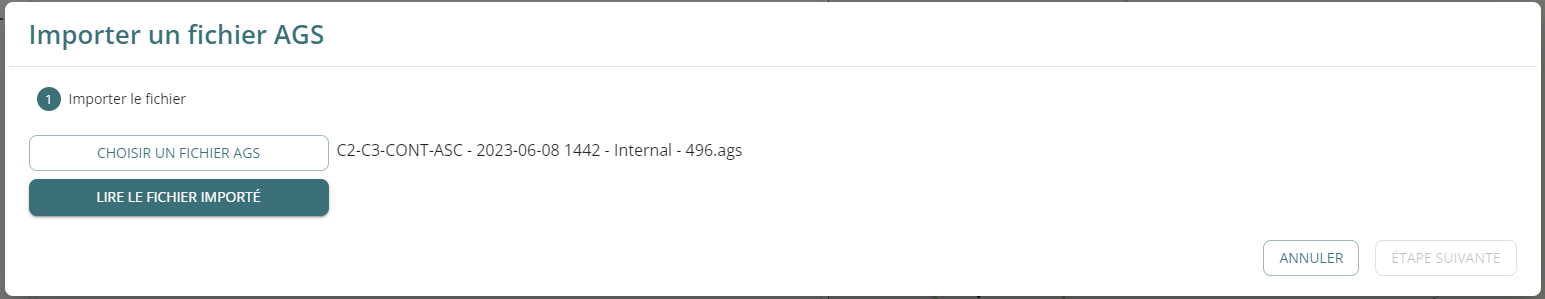
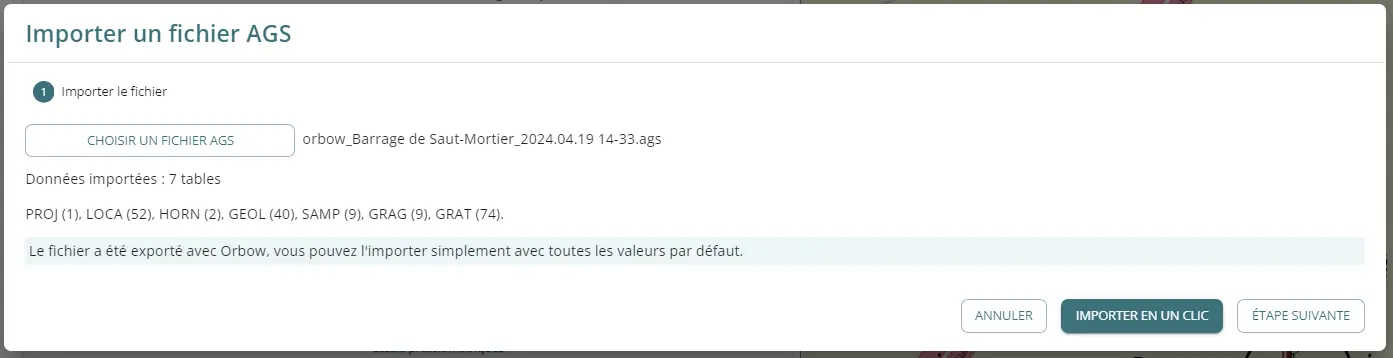
On the page listing the references, the following button opens a window for selecting a file in .ags format.
Once you have chosen the file, click on "Read the imported file" and click on "Next step".
If this file has been exported by Orbow, you can re-import it with 1 click:
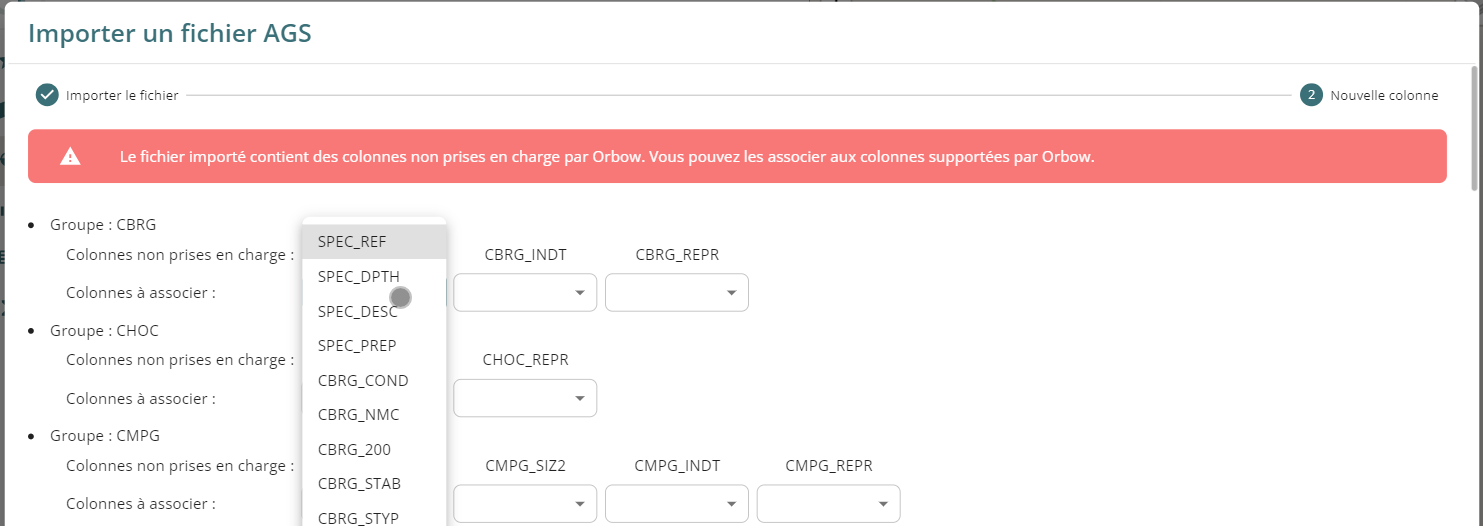
Otherwise, you are redirected to a new page listing the tables in which any "unofficial" columns are present (the AGS format allows columns to be added to tables, with the constraint of declaring them in the DICT dictionary table).
If you wish, Orbow can match columns present in the database.
However, it is not possible to import data from 'unofficial' tables.
Coming soon
The column names will soon be more clearly labelled and translated into French.
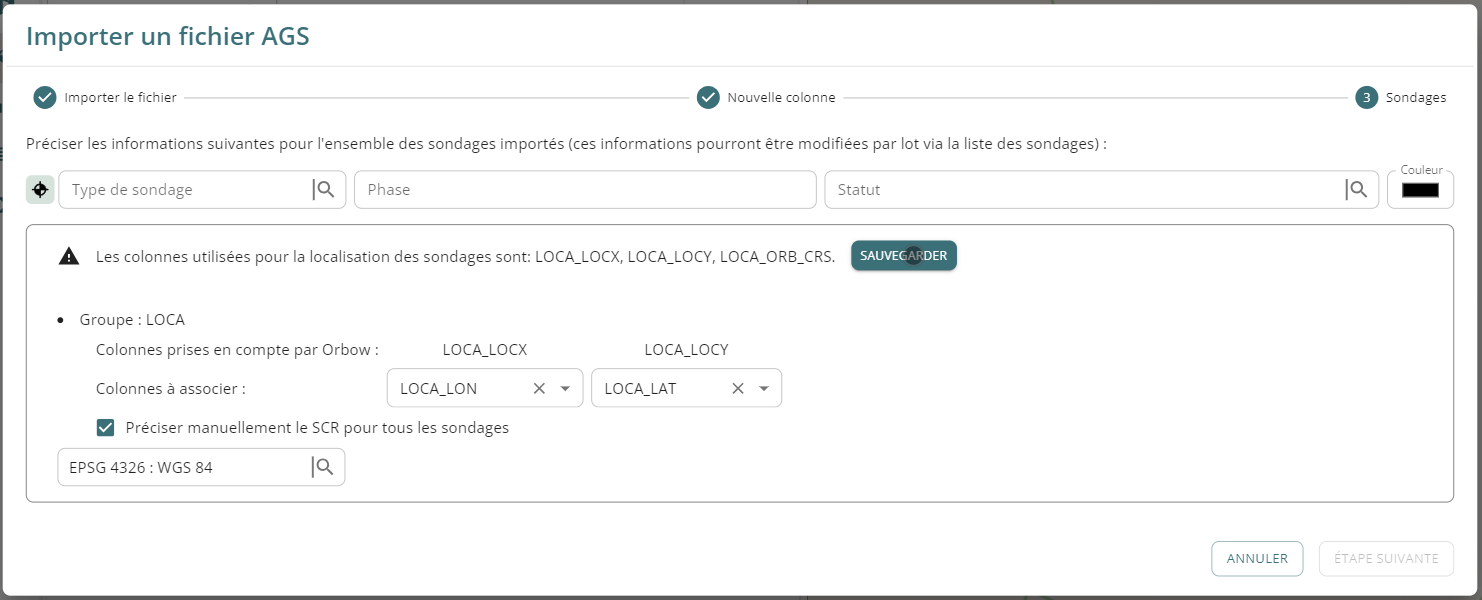
In the next step, you can :
- enter a unique type, phase, status and colour for all the boreholes (after importing, you can modify this information batch by batch from the page listing the boreholes) ;
- modify the location columns: X, Y and the SCR for each borehole. By default, Orbow uses the locx, locy columns of the LOCA table of the AGS, coupled with a column specific to Orbow named ORB_CRS in this same LOCA table. If your coordinates are stored in other columns (for example LON and LAT), you can perform the mapping. You can specify the SCR globally for all DDHs.
- modify the levelling columns: by default, Orbow uses the locz columns for the sounding head elevation and datm for the sounding levelling system.
Don't forget to click on "Save" after completing this second part if necessary.
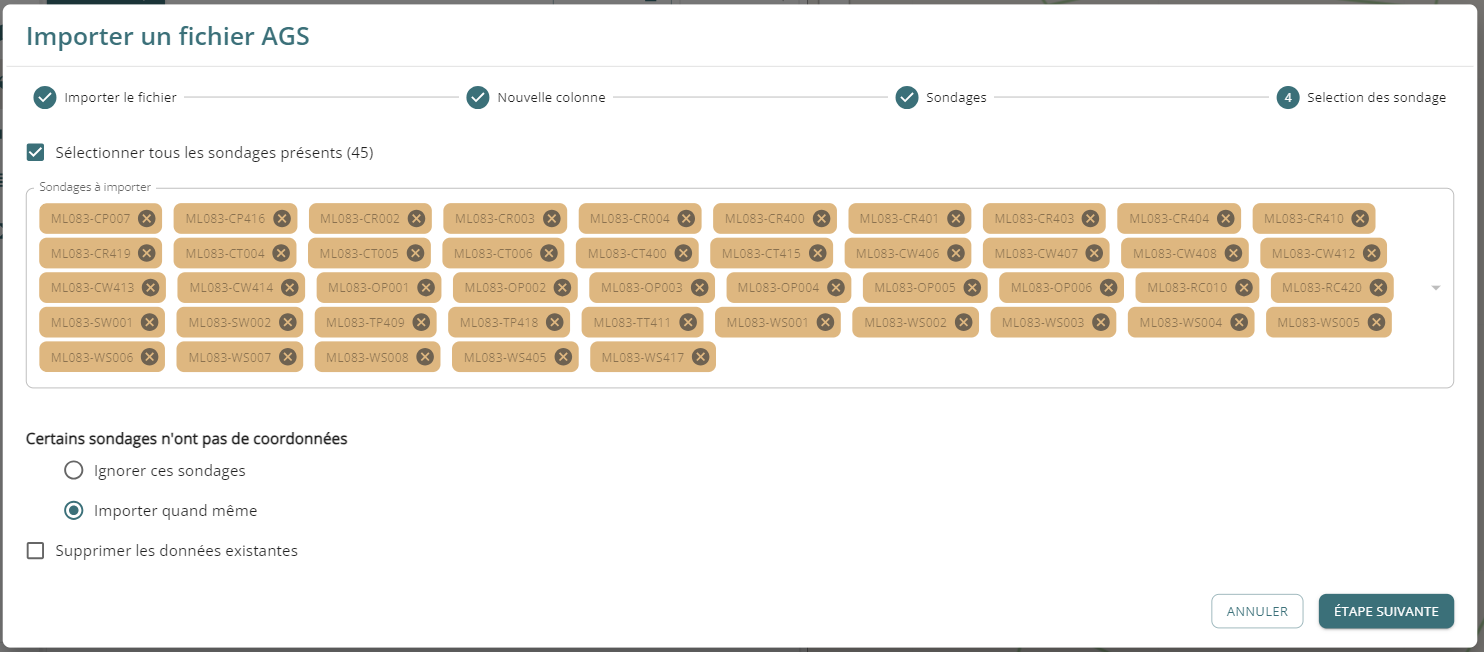
The next step allows you to select only certain boreholes for import.
If the coordinates were not found in the default columns or those indicated, you can choose to ignore them and import the boreholes anyway (you can specify their location later).
You can also delete all existing data before importing the data from the file.
The last step informs you that the soils presented in the GEOL table (fields geol_desc, geol_geol and geol_geo2) will be automatically added to the soils table.
Click on "Next" to prepare the data.
A summary is displayed:
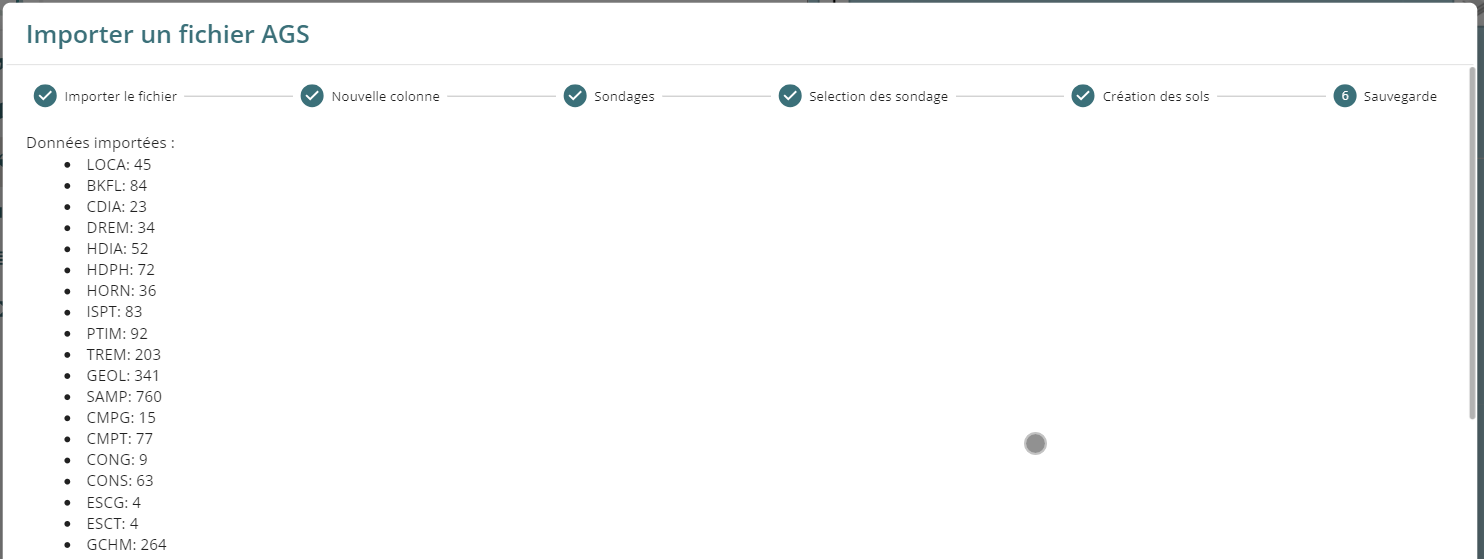
The last button, "Import into Orbow", imports all this data into the Orbow database.
Coming soon
The import function will also be gradually improved to handle more special cases.
For your information
Orbow stores certain data in specific columns.
This is the case for the type of DDH or its colour, stored respectively in the LOCA table in the loca_orb_type and loca_orb_color fields.
You can pre-fill these columns, which will then be detected during import. Or you can edit them in batches later.
See paragraph Specific fields for Orbow and the import tutorials.
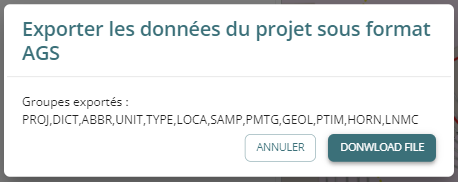
Exporting an AGS file
Alternatively, you can export all the recognition data for your project in AGS format using the same button.
A window opens. If you confirm, the interface prepares all the data (this may take some time), then suggests that you download your file:
Attach investigaton from another project
Attaching surveys from a source project to a target project allows you to use the data from these surveys in the target project, without having to reimport / duplicate them.
The attachment is a logical link to the borehole in the source project.
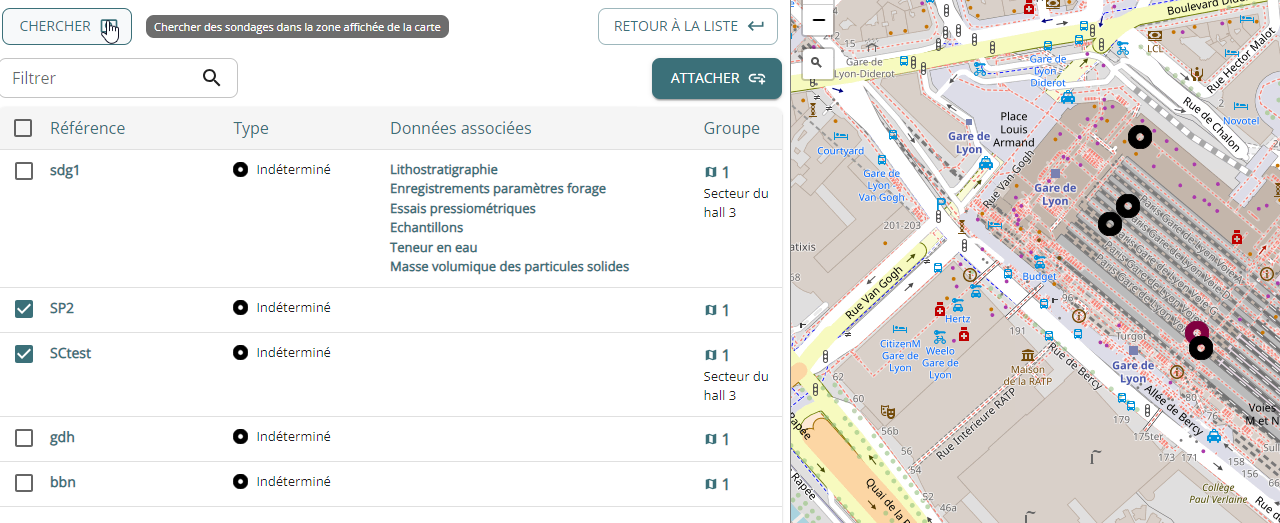
To attach a borehole in the target project :
- click on "Attach" ;
- navigate on the map ;
- click on "Search" to scan the boreholes you can see on the map;
- select the ones you want to attach to your target project;
- click on "Attach".
When you return to the list of boreholes in the target project, you will see the boreholes you have selected in the list. Next to the name of these boreholes , an icon 🪢 allows you to detach the attached boreholes one by one. You can select several and detach them all at once using the "edit" button.
Clicking on the boreholes will take you to the source project, provided you have the rights to access this data.
A group with the source project ID is automatically generated. You can click on this group to access the project.
Groupings
Automated systems by area
Boreholes within the polygon delimiting a sector are automatically included in a group bearing the name of the sector.
These groups appear on the listing the references page.
In analysis tools, these groupings can be used, for example, to present test value statistics by area.
Manuals
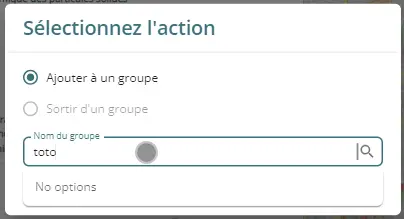
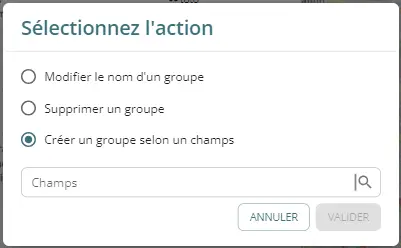
You can manually create survey groups using the  button. To do this, first select one or more surveys, then click on the button, then click on "Add to group" and give your group a name:
Once you have validated, the name of this group appears for the selected surveys, along with a specific indicator. You can easily filter according to this group using the dedicated field.
The option to remove a survey from a group is available when you manually select a grouped survey and then click the "Group" button again.
You can delete a group via the same button when no survey is selected; or rename a group.
According to a field
This function lets you automatically create groups based on an enumeration or text field present in the LOCA table (i.e. everything that appears in a survey's ID card).
The most common use case is to automatically group according to survey phase.
To do this, without first selecting a survey, click on "Group", select "Create a group by field" and then choose the field. For the phase, choose LOCA_CLST.
The application will automatically add each survey to a group named according to the value indicated in this field:
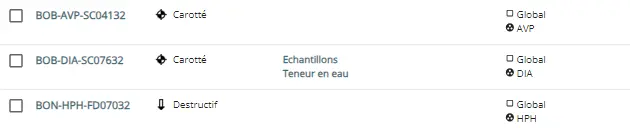 If this field is modified for a poll, the grouping will be automatically updated.
You can delete a grouping by field in the same way as you delete a manual grouping.
Batch editing
Using the "Edit" button, which is activated when you select several boreholes, you can change the type, phase, status and colour of a set of boreholes on the map:
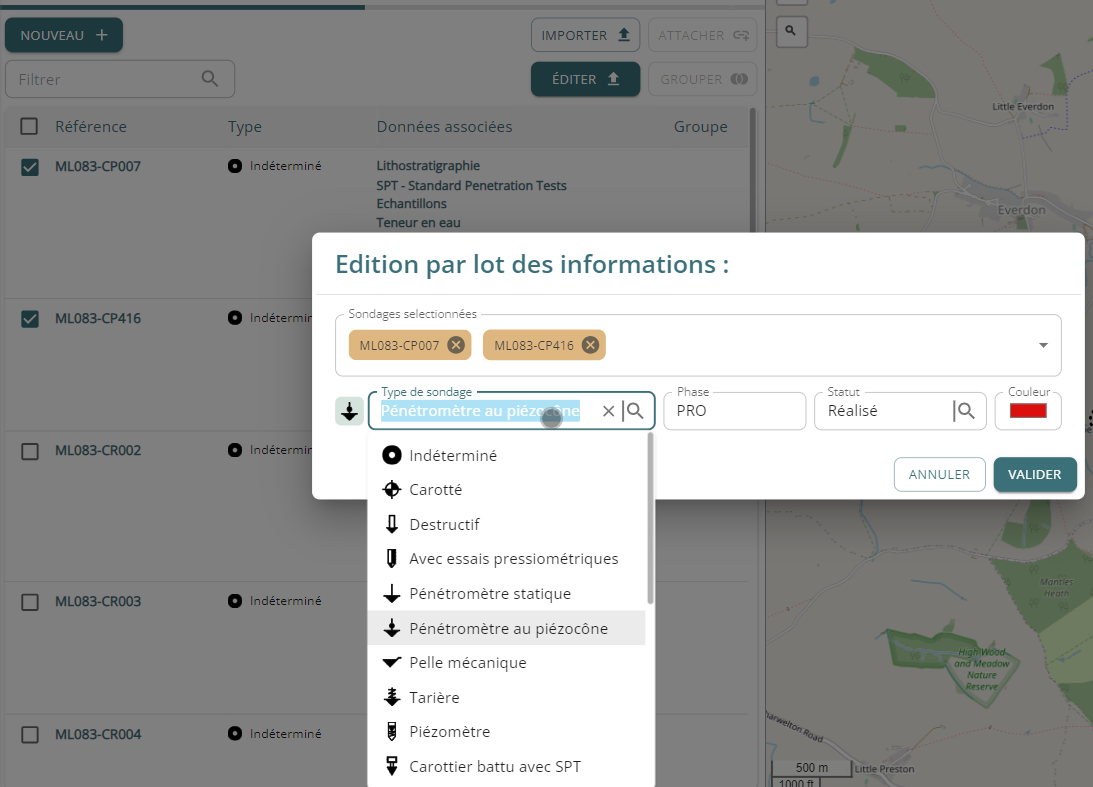
You can also delete the selected boreholes (a confirmation window will ask you to enter the project ID), or detach the boreholes if they are links.
Borehole data
To access a poll, you can :
- click on its name in the "list" page ;
- click on its icon on the map (even if you are in another Orbow brick) ;
- by scrolling through the names in the breadcrumb trail :
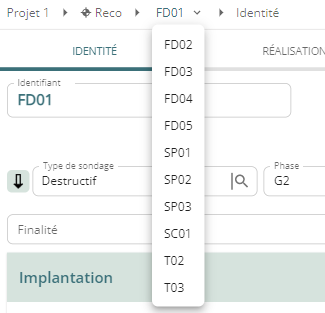
Identity card
After validating the borehole creation, or accessing a borehole by one of the three means listed above, you arrive on the poll identity page.
You can rename the poll at will, specify its type, and therefore the icon that will be displayed on the map, its display colour, etc.
You can reposition the location, either with the mouse using the "pin", or precisely using the coordinates in the chosen SCR.
Following the logic of AGS, Orbow allows you to specify the inclination of the borehole by sections.
All you have to do is click on the 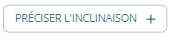 button.
In the "Change history" section, you can manually leave a record of any changes you have made to the borehole or data:
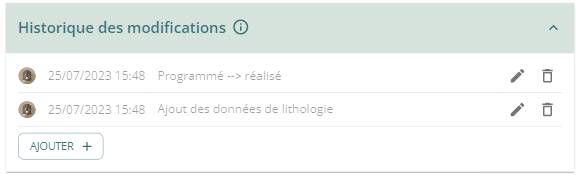
Changes are saved manually, so don't forget to click on 💾 to save your comment. Only you can edit your comment, you cannot edit comments posted by other users.
At the bottom of the page, the "Duplicate" button allows you to duplicate the borehole, particularly useful if you want to keep the borehole's data in a certain state before modifying it.
Next to the borehole name is a button ⛔ which allows you to indicate that the borehole is to be discarded for analysis in the analysis modules. The borehole will no longer be visible on the map.
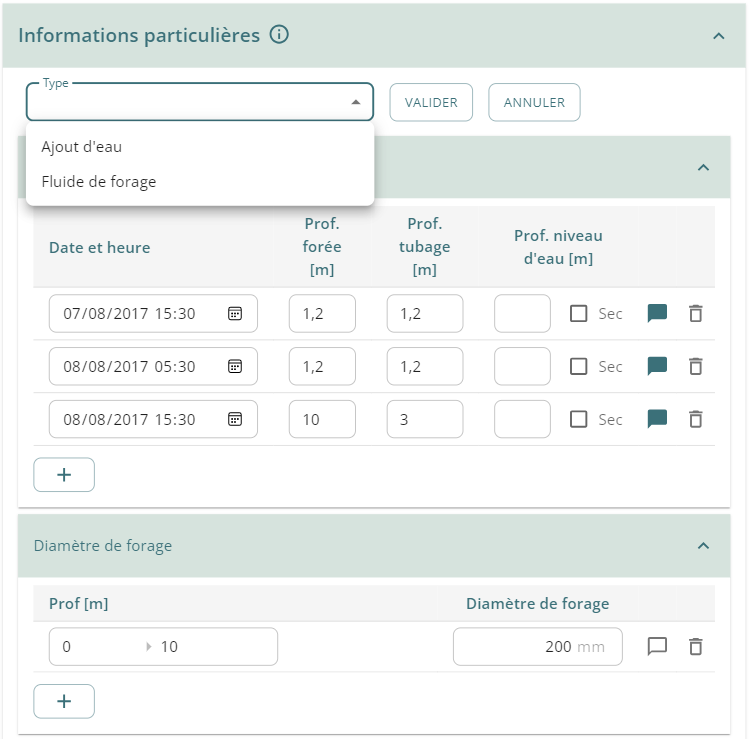
Execution page
As the name suggests, the execution page provides access to forms for save data relating to the production of the borehole in the ground.
In the "General information" section, you can specify the (main) company responsible for carrying out the borehole, the operator and the start and end dates.
The second part of the page allows you to enter, depth by depth, in the form of a table, detailed information on how the boreholes were drilled.
A dozen forms are available:
- Drilling progress
- Addition of water
- Drilling fluid
- Drilling diameter
- Drilling tools
- Casing
- Cementing
- Sonar cut
- Weather
- etc.
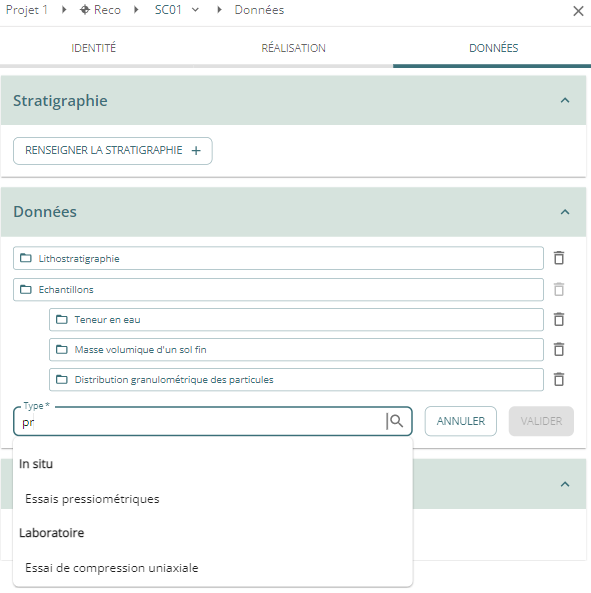
Associated data
The third "data" page for a borehole contains 3 parts:
- stratigraphy, which graphically displays the cross-section entered in the lithostratigraphy container ;
- the types of data associated with the borehole ;
- the files associated with the borehole.
To add data to a borehole, simply select a data container from the list in the "data" section.
For your information
You can enter the first few letters of the type you are looking for to find it more quickly.
If you have chosen a type of laboratory test and have not created the "samples" type beforehand, this is created automatically.
The "Fill in stratigraphy" button automatically adds the lithostratigraphy data container and opens the page.
When you click on the button of a data container, the content page is expanded to the right:
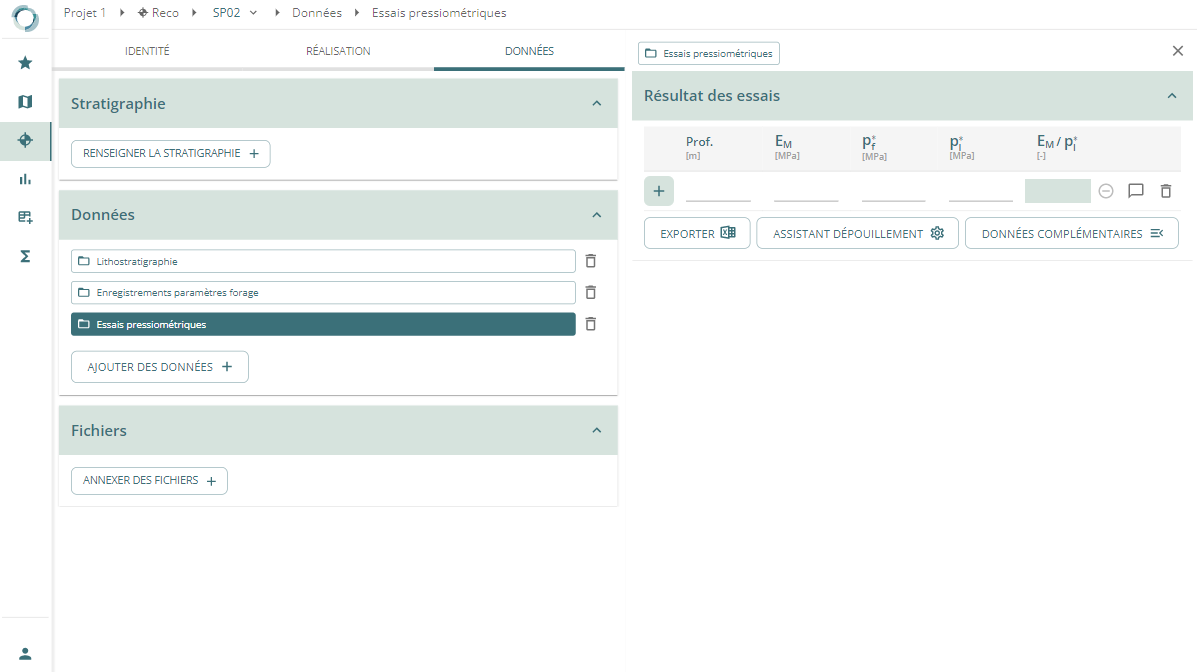
The delete button is used to delete the data container and all associated underlying data.
Coming soon
Not all forms are available yet. Other forms will be added to the current list.
The following table lists the data forms and their availability at the time of writing:
| French name | English name | Result form | Advanced form/counting |
|---|---|---|---|
| In situ | |||
| Lithostratigraphie | Lithostratigraphy | ✔ | |
| Enregistrements paramètres forage | Drilling / Advancement observations & parameters | ✔ | |
| Photographies | Photographs | ✔ | |
| Information de carottage (récupération / RQD) | Coring information | ✔ | |
| Essais pressiométriques | Pressuremeter tests | ✔ | |
| CPT - Essais au pénétromètres statique | CPT - Static Cone Penetration Test | ✔ | |
| SPT - Standard Penetration Tests | SPT - Standard Penetration Test | ✔ | |
| Piézomètres | Piezometers | ||
| Mesures de niveaux d'eau | Water level readings | ||
| Essais au pénétromètre dynamique | Dynamic Cone Penetrometer Test | ✔ | |
| Essais de pompage | Pumping tests | ||
| Essais à la plaque | Plate loading test | ||
| Echantillons | Sample | ✔ | |
| Laboratoire | |||
| Teneur en eau | Water content | ✔ | |
| Masse volumique d'un sol fin | Bulk density | ✔ | |
| Masse volumique des particules solides | Particle density | ✔ | |
| Distribution granulométrique des particules | Particle size distribution | ✔ | |
| Limites de liquidité et de plasticité | Liquid and plastic limits | ✔ | |
| Essai au bleu de méthylène | Methylene blue test | ||
| Essai œdométrique | Œdometer test | ||
| Essai de compression uniaxiale | Unconfined compression test | ||
| Essai triaxial | Triaxial test | ||
| Essais de cisaillement direct | Direct shear test |
For all types of test, the  icon becomes
  and is used to label the test as "discard the test" for later analysis in the analysis tools.
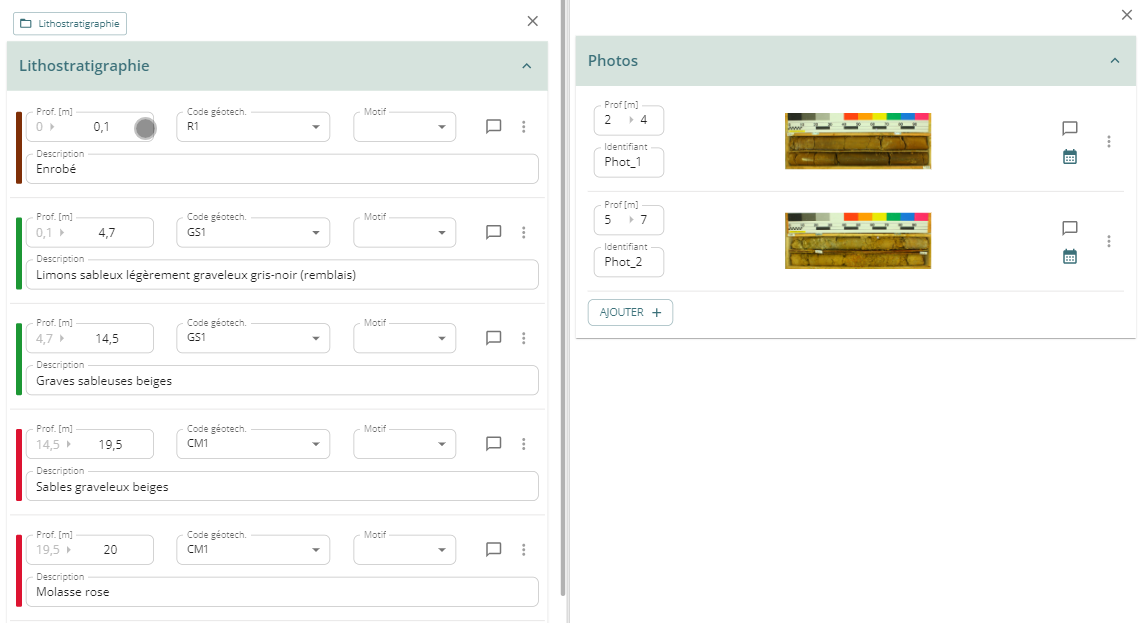
Lithostratigraphy
This page describes the lithostratigraphy of a borehole:
- the lithology at borehole level: thickness of each layer and description ;
- the stratigraphic interpretation of each lithological layer: geotechnical facies assignment defined in the soils table.
As the table is completed, the graph on the data page is updated.
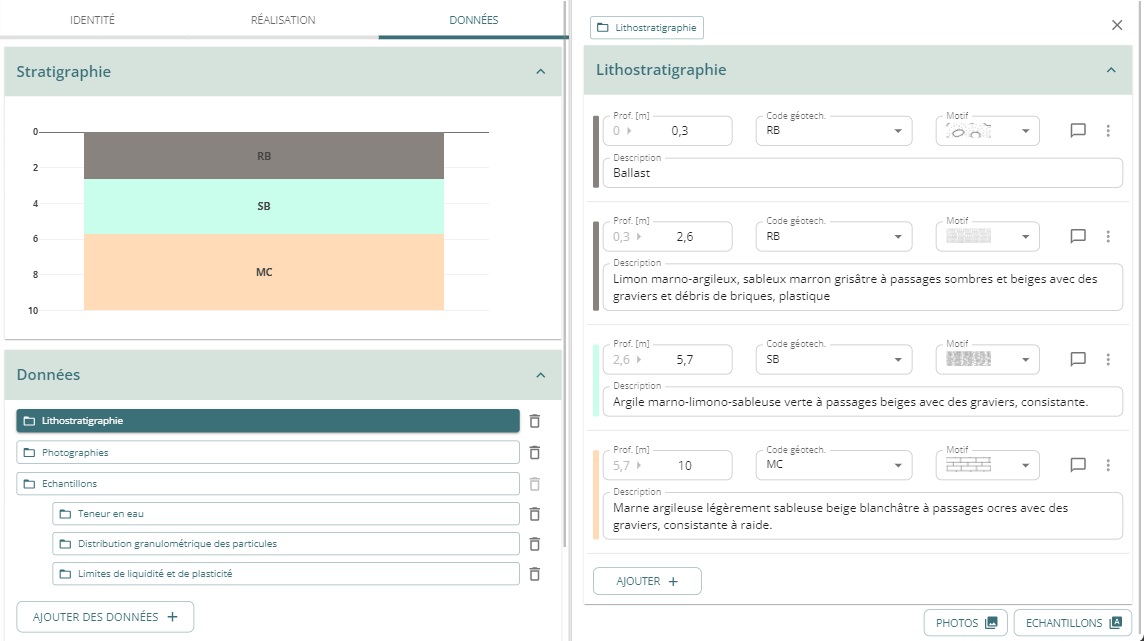
Use the menu on the right to insert a line between two existing lines.
In this case, check the dimensions that have been applied.
For your information
This page can be used in a simplified way to quickly describe the stratigraphy of the borehole, without including a description of each lithological layer.
Drilling parameters
This page is used to import drilling parameters (foward speed, torque etc.).
To import from an xlsx or csv file, click on the  button.
This opens a window that lets you load a file from your computer, and map the columns in your file to the columns in the database.
button.
This opens a window that lets you load a file from your computer, and map the columns in your file to the columns in the database.
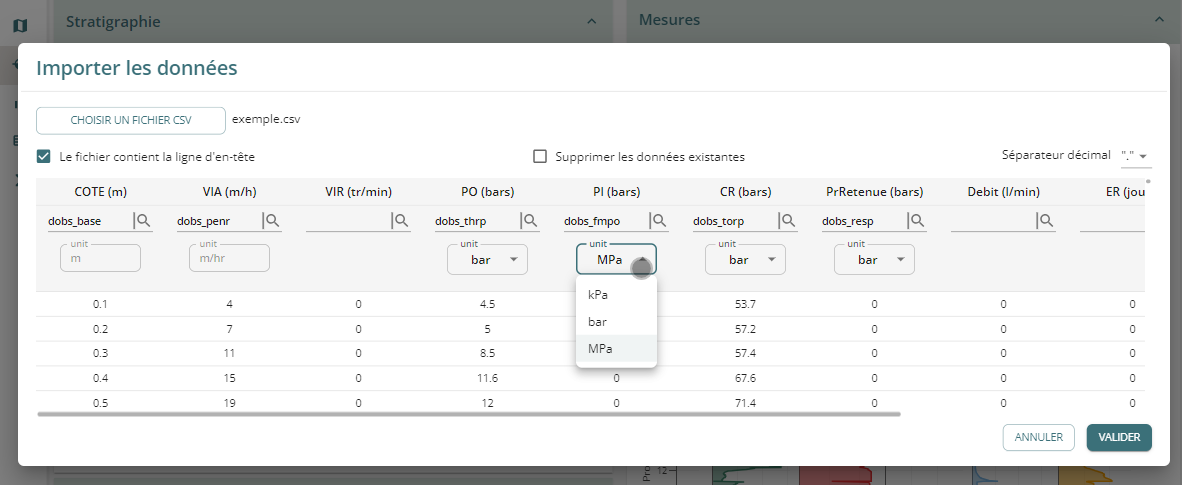
You can also change the pressure import unit of your source file: kPa, bar or MPa.
Coming soon
The choice of column correspondences will be more explicit in the near future.
For your information
In the meantime, the following table gives details of the correspondences:
| Field name | AGS field name |
|---|---|
| Depth [m] | dobs_base |
| Penetration rate [m/h] | dobs_penr |
| Thrust pressure [bar] | dobs_thrp |
| Holdback pressure [bar] | dobs_resp |
| Flush pressure [bar] | dobs_fmpo |
| Torque pressure [bar] | dobs_torp |
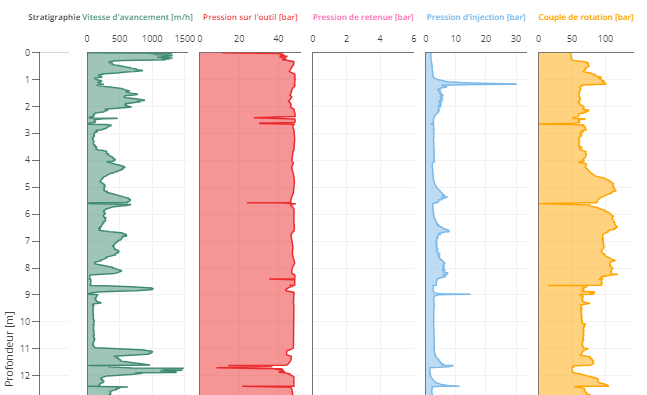
Once the import has been loaded, the graph is displayed directly:
You can proceed in the same way for one or more calibration measurements, with the option of filling in a description field to describe the type of calibration.
Photographs
You can upload photos to Orbow, linked to a survey.
Typically, these are photos of soil cores or shovel excavations. For photos of samples, it is best to store them using the adapted form.
You can display the lithostratigraphy page and the photos page side by side.
To add a photo, indicate the depth of the roof and base corresponding to the photo and upload your file. The identifier is filled in automatically (but you are free to change it). You can also add a comment and specify the date the photo was taken.
To enlarge the photo, click on it or open it in another tab.
For your information
Large photos are automatically compressed.
The quality of the compression and resolution reduction has been calibrated to remain acceptable for the intended use.
Nevertheless, we recommend that you always keep your source files.
Core drilling information
This page includes a table allowing you to enter :
- Drilling diameter ;
- Recovery rate ;
- RQD value;
- Drilling time.
You can display this form side-by-side with photographs of the core samples. You can also view the information entered on a graph.
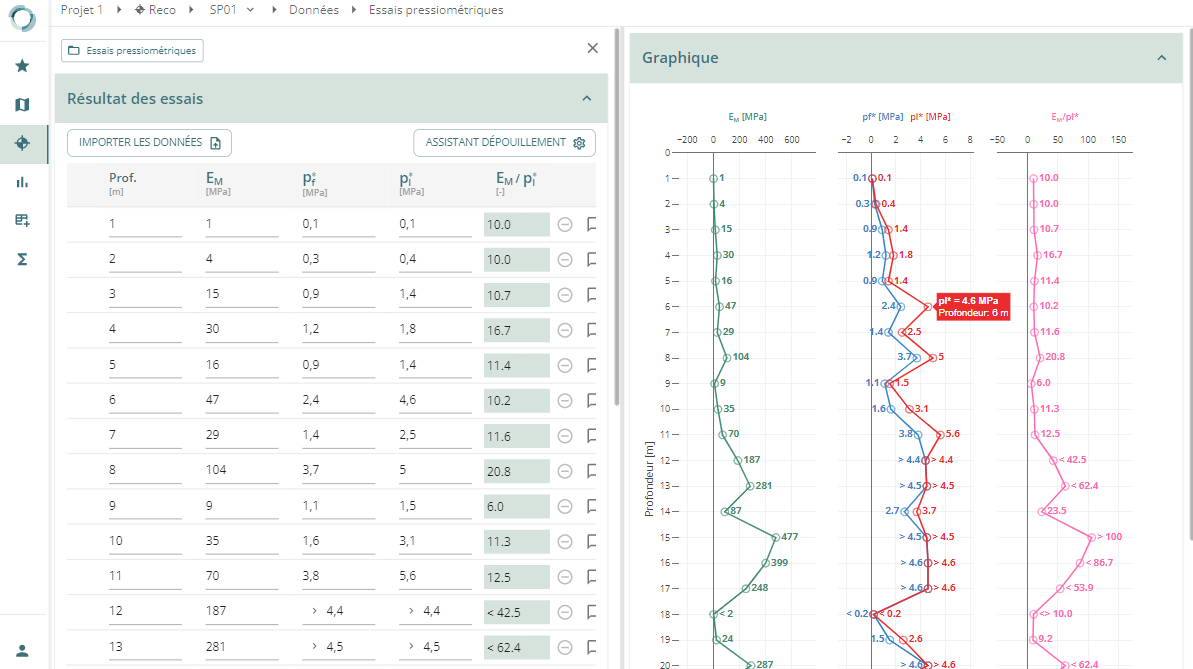
Pressuremeter tests
Click on the "Pressuremeter tests" button in the list to display a page.
Empty beforehand, you can click on the  button to create the data table and enter your data.
You can specify if a value is over or underestimated in this way:
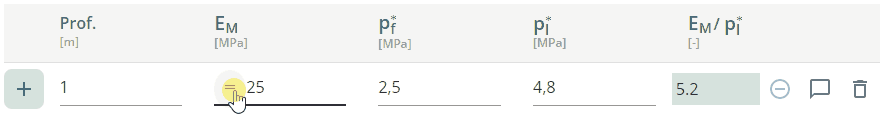
Click on the ➕ to add a new line.
For your information
Tests are automatically sorted by depth.
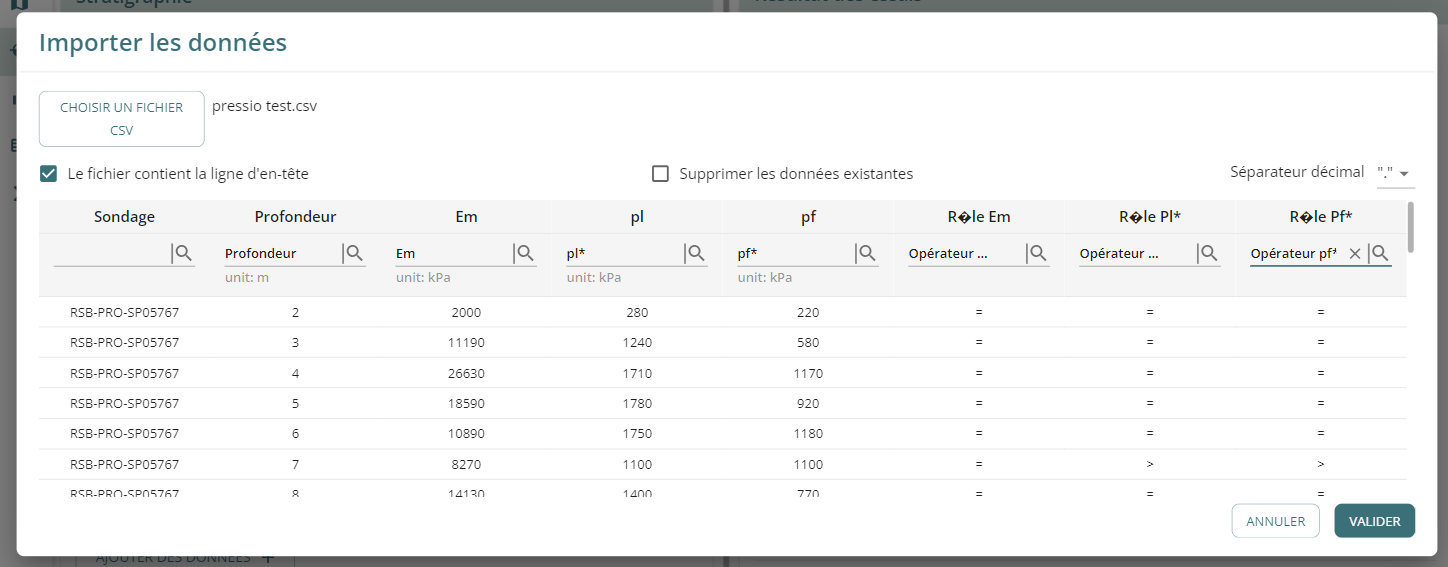
You can also import data from an xlsx or csv file using the  .
.
A window then opens, allowing you to upload your file, and to associate the columns of your file with those of the Orbow table, in the same way as for the drilling parameters.
You can view a graph of the values entered by pressing the "Shart" button below the table.
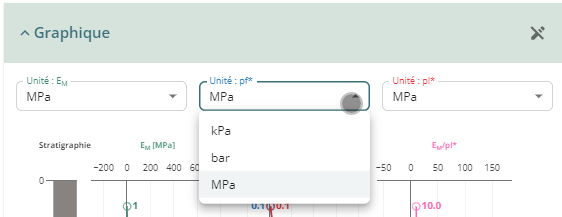
Use the ✏️ button in the page title to change the display units for the various values:
Coming soon
The pressuremeter test analysis tool will soon be connected to this page.
It will also be possible to enter additional information for each test (values for tests with cycles, for example).
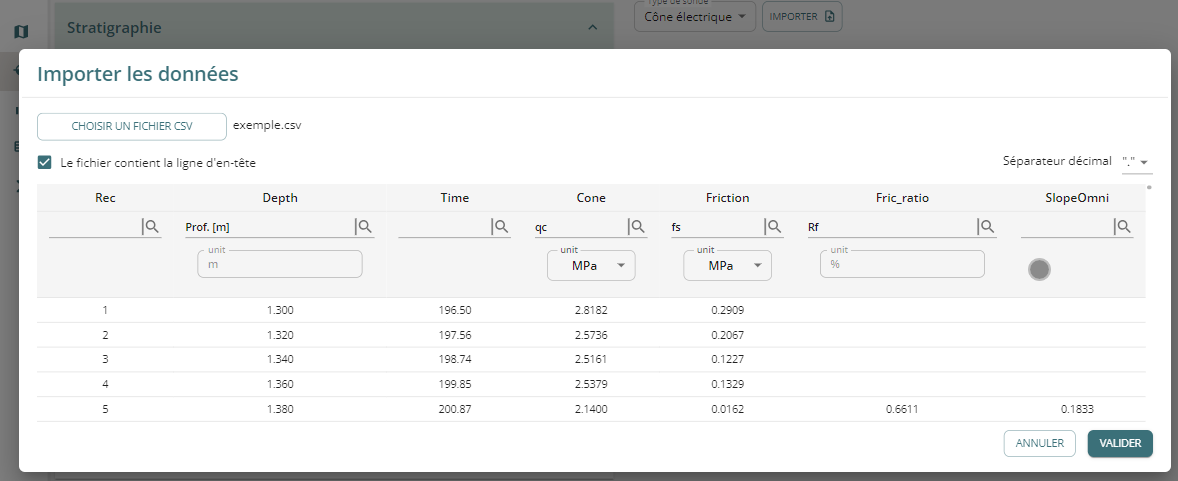
CPT - Static cone penetration test
This page works in a very similar way to the one used to enter drilling parameters.
An import button allows you to select a xlsx or csv file on your workstation and to indicate the mapping of the columns to the database.
The names of the target columns will be improved shortly, but in the meantime the correspondences are shown in the example below:
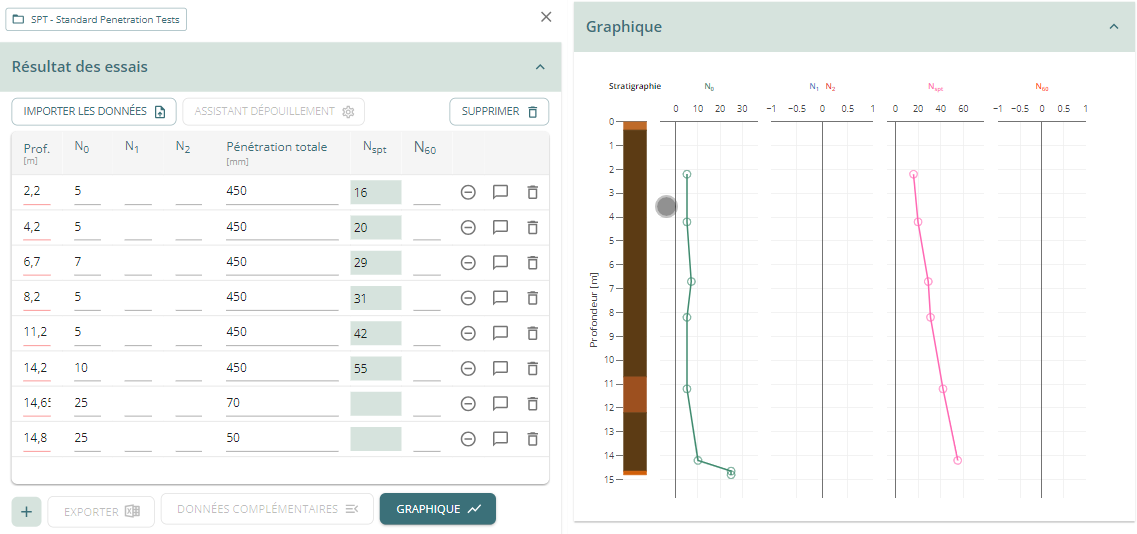
Standard Penetration Test - SPT
The SPT form allows you to enter/upload Standard Penetration Test results.
The form is very similar to that used for pressuremeter tests.
The \(N_{spt}\) is calculated as the sum of \(N_1\) et \(N_2\).
However, you can enter it without going through these intermediate values by using table mode.
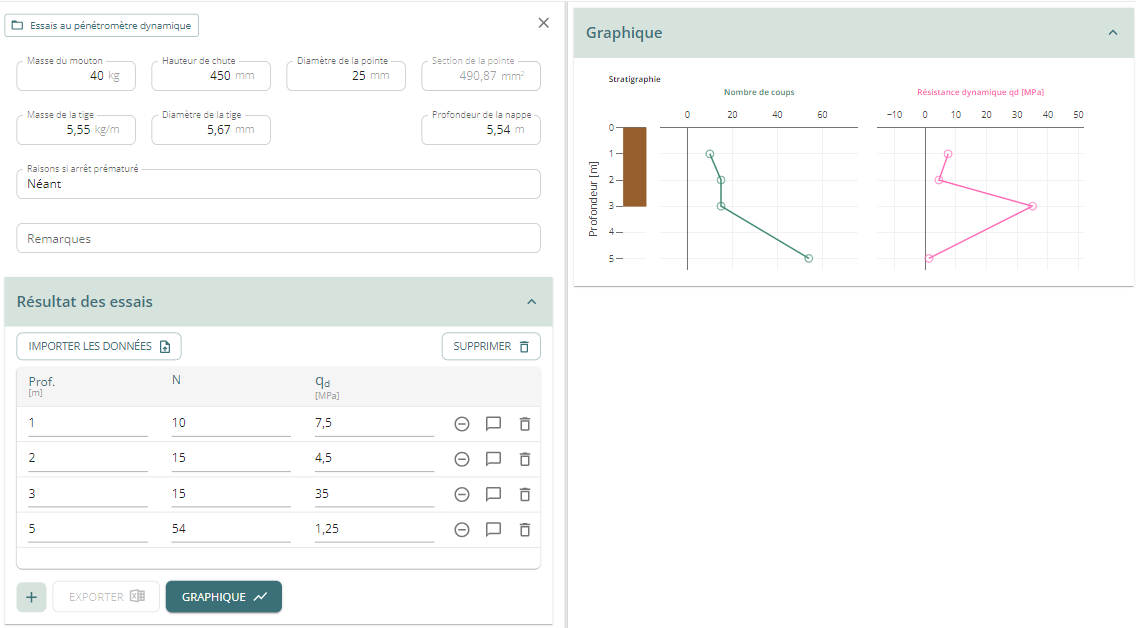
Dynamic penetrometer test
This form is also similar to the one for pressuremeter or SPT tests, and allows you to enter data for dynamic penetrometer tests.
A form allows you to enter the material data, then a table allows you to enter the test values.
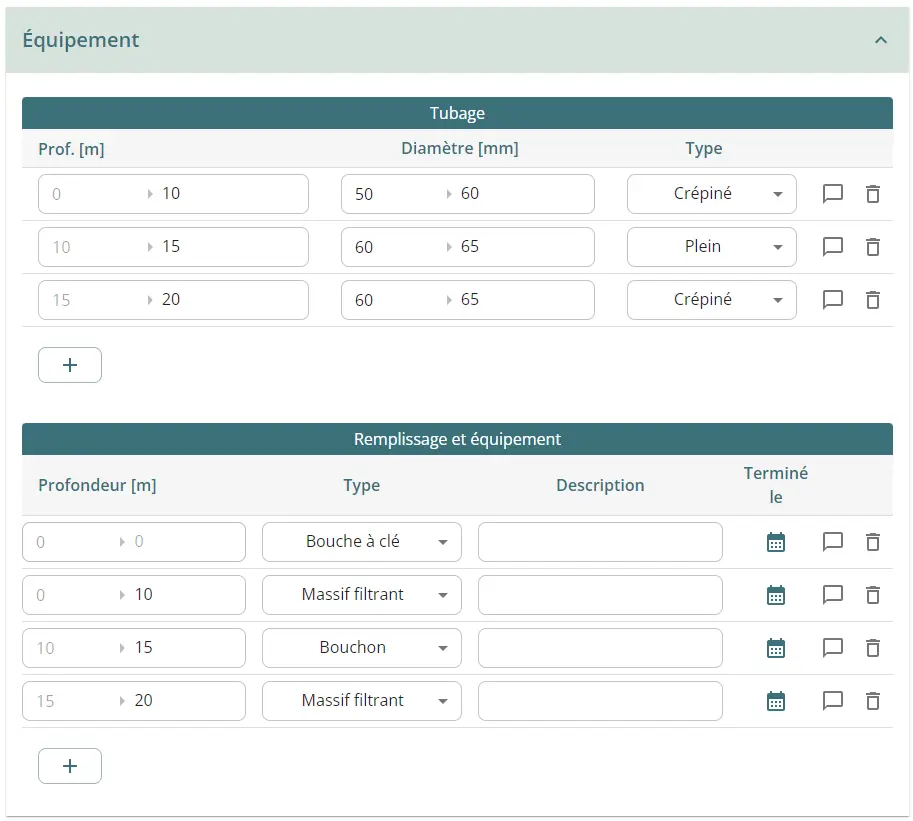
Piezometers and piezometric measurements
The page dedicated to piezometers includes several sections:
- a form for specifying the casing and equipment
- a measurement graph when measurements are entered
- as many measurement tables as measurement sets created
Example of filling in the "equipment" section:
Example of filling in the "equipment" section :
- You can create several slotted sections if there is more than one piece of equipment in the piezometer, which you can then indicate as the source of a set of measurements.
- If you select "Upstanding cover" or "Flush cover", the depth is automatically forced to 0.
You can then create as many measurement groups as you need, associating each group with a slotted section. You can create several groups for the same well-slotted section (e.g. to differentiate between a change of measuring device):
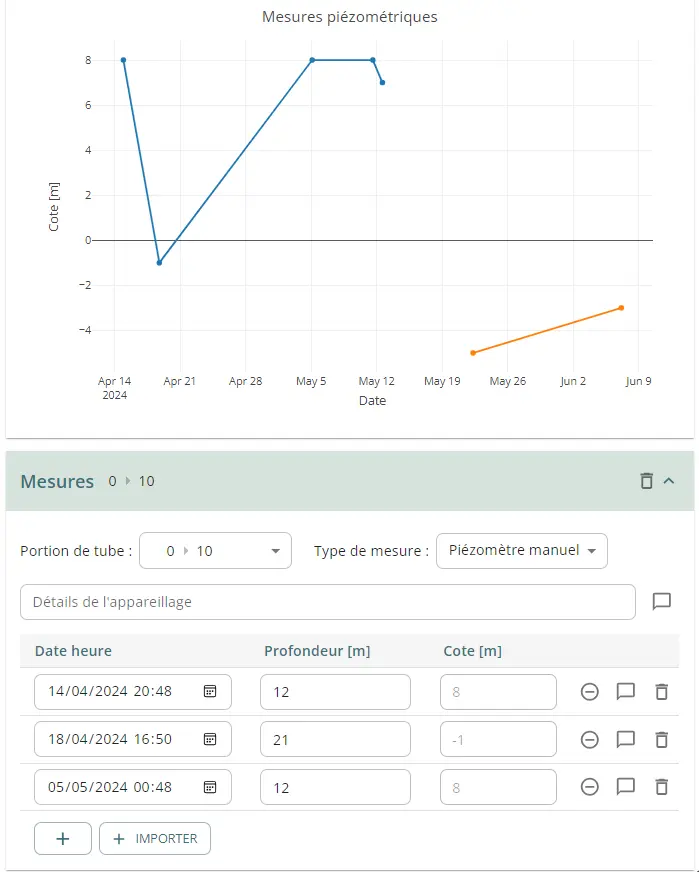
The points displayed on the graph are grouped by screened section, even if several groups have been created for this section.
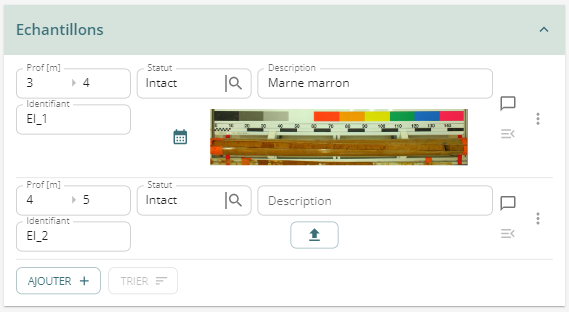
Samples
This page is used to declare the samples taken from a borehole. All you need to do is enter :
- the depth of the roof and base of the sample ;
- a status (intact or reworked) ;
- a description ;
- an identifier (automatically created, but which can be modified);
- the photo of the sample and the date on which it was taken: the photo will be automatically resized/converted to a smaller image format if its size exceeds a certain limit (a message will be displayed to warn you);
- a comment via the dedicated icon.
Coming soon
You can use the  icon to add further information in the near future.
Use the menu on the right of each line to delete the sample. Use the icon at the bottom to manually sort the tests by depth.
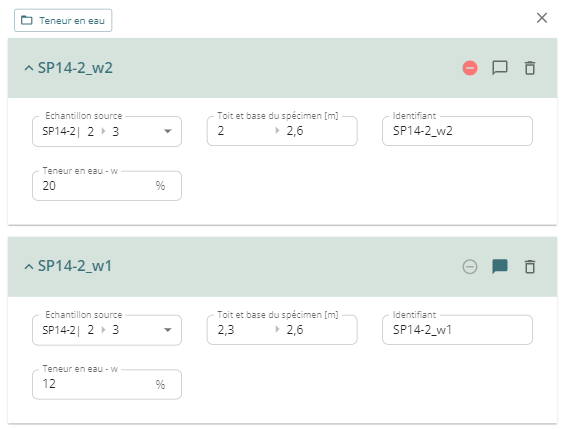
Water content
CThis page is used to define water content tests. Please note that you must first create samples.
Click on the "Add" button to create a trial. A block is created, allowing you to :
- choose the source sample ;
- specify the top and base of the specimen taken from the sample (in absolute depth);
- if you are not happy with the default, change the identifier for the test;
- specify the water content value in %.
In the title bar, you can also use the ⛔ icon to discard the trial in the analysis tools, leave a comment, or simply delete the trial.
Coming soon
The page will shortly be expanded to include additional information on the trial and a counting assistant.
Density of fine soil
This form follows exactly the same logic as the water content form.
Density of solid particles
This form follows exactly the same logic as the water content form.
Particle size distribution
Use this form to add the results of particle size distribution tests:
- by sieving ;
- by sedimentometry.
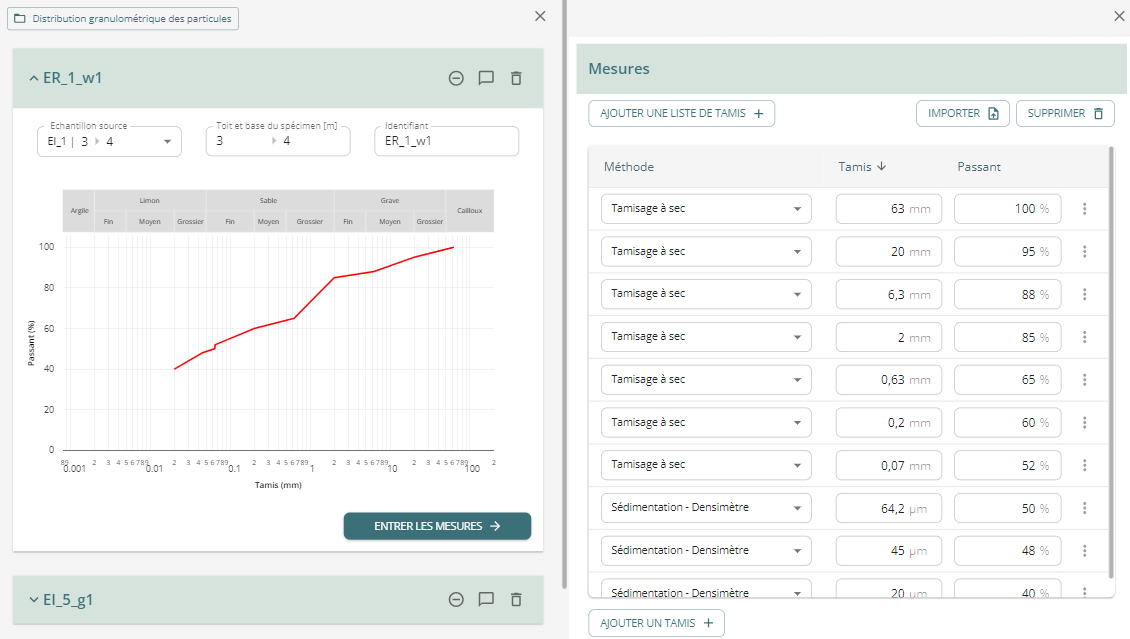
Once the test has been created by selecting the source sample and the depth of the specimen (sub-sample), you can unfold the table to enter the measurements via the dedicated button, then add a sieve line by line, import from a csv or Excel file, or add a predefined list of sieves (according to French standards) with the dedicated button.
The graph is updated as each line of the table is filled in.
Limit of liquidity and plasticity
This form follows exactly the same logic as the water content form.
Coming soon
The "Casagrande" plasticity diagram will shortly be added to the page.
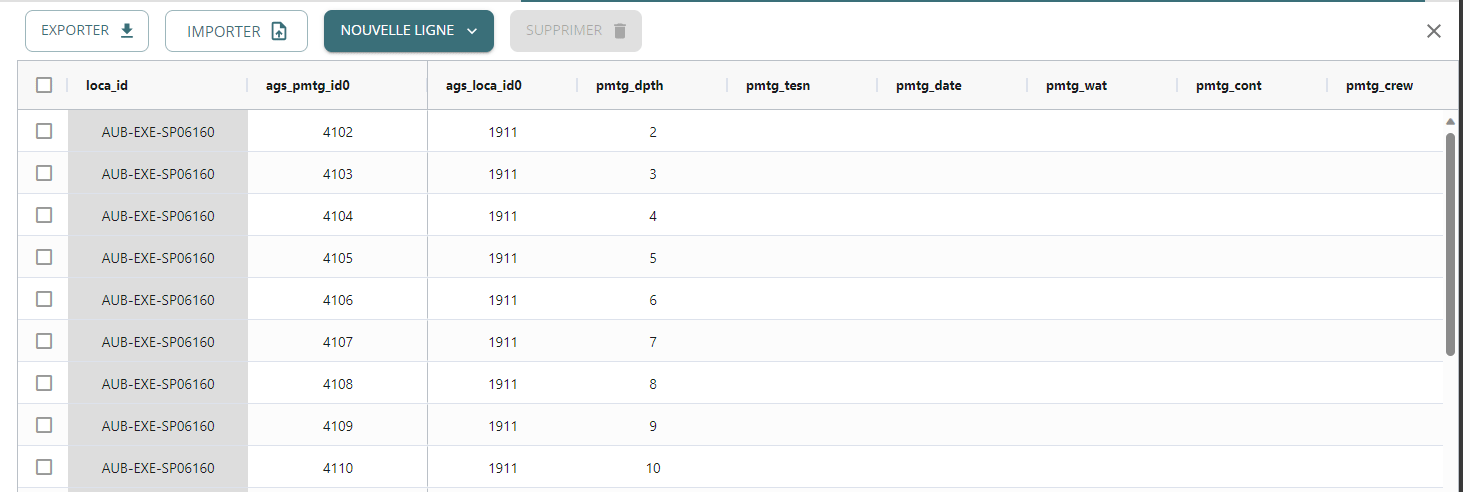
Table mode
The "Tables" tab provides direct access to the tables in the project's reconnaissance database.
For your information
Orbow displays the AGS nomenclature (table and column names) and custom column names.
Visualisation
As mentioned in the paragraph describing the Database design, table mode allows you to view and edit tables as you would in Excel.
You can view the contents of a table simply by clicking on the button with its name in the list on the left:
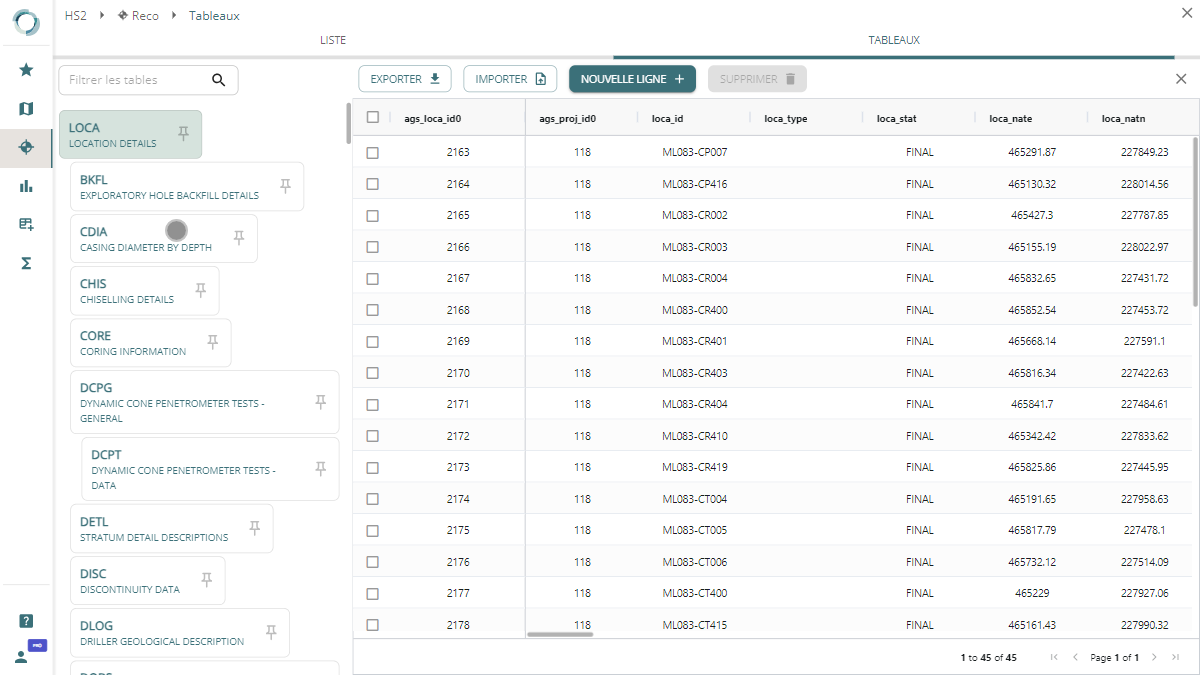
The indentation of the button represents the depth of the table in the database:
- the LOCA table (reconnaissance location) is the root of the database for a project;
- the in situ test tables are generally in row 2, the children of the LOCA table;
- the SAMPLE table is also in row 2, a child of LOCA ;
- laboratory tests are stored in row 3 tables, children of the SAMPLE table.
The buttons of the tables with data are coloured and the number of rows in each table is indicated next to its name.
The icon next to the filter field is used to hide tables with no data.
For your information
The root table in the AGS documentation is the PROJ table, which is used to name the project.
Orbow includes a much larger database than the one built from the AGS.
The PROJ table is therefore not visible in this list, but it does exist in the database to ensure compatibility when exporting.
The data present in boreholes identity card is all stored in the LOCA table, with the exception of the table used to define inclinations, whose data is stored in the HORN table.
Coming soon
Buttons will soon make it possible to move very quickly from a form to the table storing the data for that form.
Not all database columns are displayed by default. This is particularly true of all AGS-specific columns not used as standard in Orbow. You can, however, display them using the "Advanced Table" mode:
Editing tables
The tables can be edited directly.
Columns in gray are not editable; some indicate parent IDs, and are pinned on the left, while others are automatically calculated from other columns.
To edit a value, simply double-click and edit the box.
By clicking on the column headings, you can move the columns, pin them or even hide them by moving them outside the table:
When the page is reloaded, the table will return to its initial configuration.
You can also sort a column using the arrow, or click on the menu to filter the rows by a character string.
To add new rows, click on the "New row" button, and search for the parent of the new rows (you can combine character strings with "*").
Specific fields for Orbow
Orbow is built on the AGS, but data types are sometimes missing from the AGS to meet the needs of the application. New data is systematically entered into existing tables using the nomenclature xxxx_orb_yyy where xxxx is the name of the table and yyy is the name of the data.
These additions are referenced in tables :
- DICT which refers to the new columns and the description ;
- ABBR, which references the lists of possible values for the columns that are selectors.
These two tables can be viewed at the end of the list in the table editor.
Import and export
You can export tables in csv and Excel format using the appropriate button. A csv file of the table is automatically downloaded to your computer. You can export the entire table or just the view (displayed columns and filtered rows).
For your information
The character encoding for exported csv files is UTF-8.
It is possible that the simple opening of the file in Excel does not work correctly with certain characters (accents, etc.).
In this case, use the "Data / Import from a text / CSV file" function in Excel.
Excel will then detect the source encoding correctly.
In each table, if the parent table contains data, you can import data from an xlsx or csv file.
For your information
Import is done table by table.
You therefore need to have at least one row in the table with rank n to be able to create data in the tables with rank n+1.
You can still import into the LOCA table. Simply load an xlsx or csv file, match the columns in your file to those in the Orbow LOCA table, and a survey will be created for each line in your file.
The rules for specifying the columns to be used for the boreholes are the same as those described in the paragraph Import an AGS file.
You can consult the dedicated tutorial for guidance and tips relating to these specific fields.
To find out how to import into the LOCA table's daughter tables, see the dedicated tutorial.
Edit reports
The "Report" tab lets you transform the data in the reconnaissance database into a printable report:
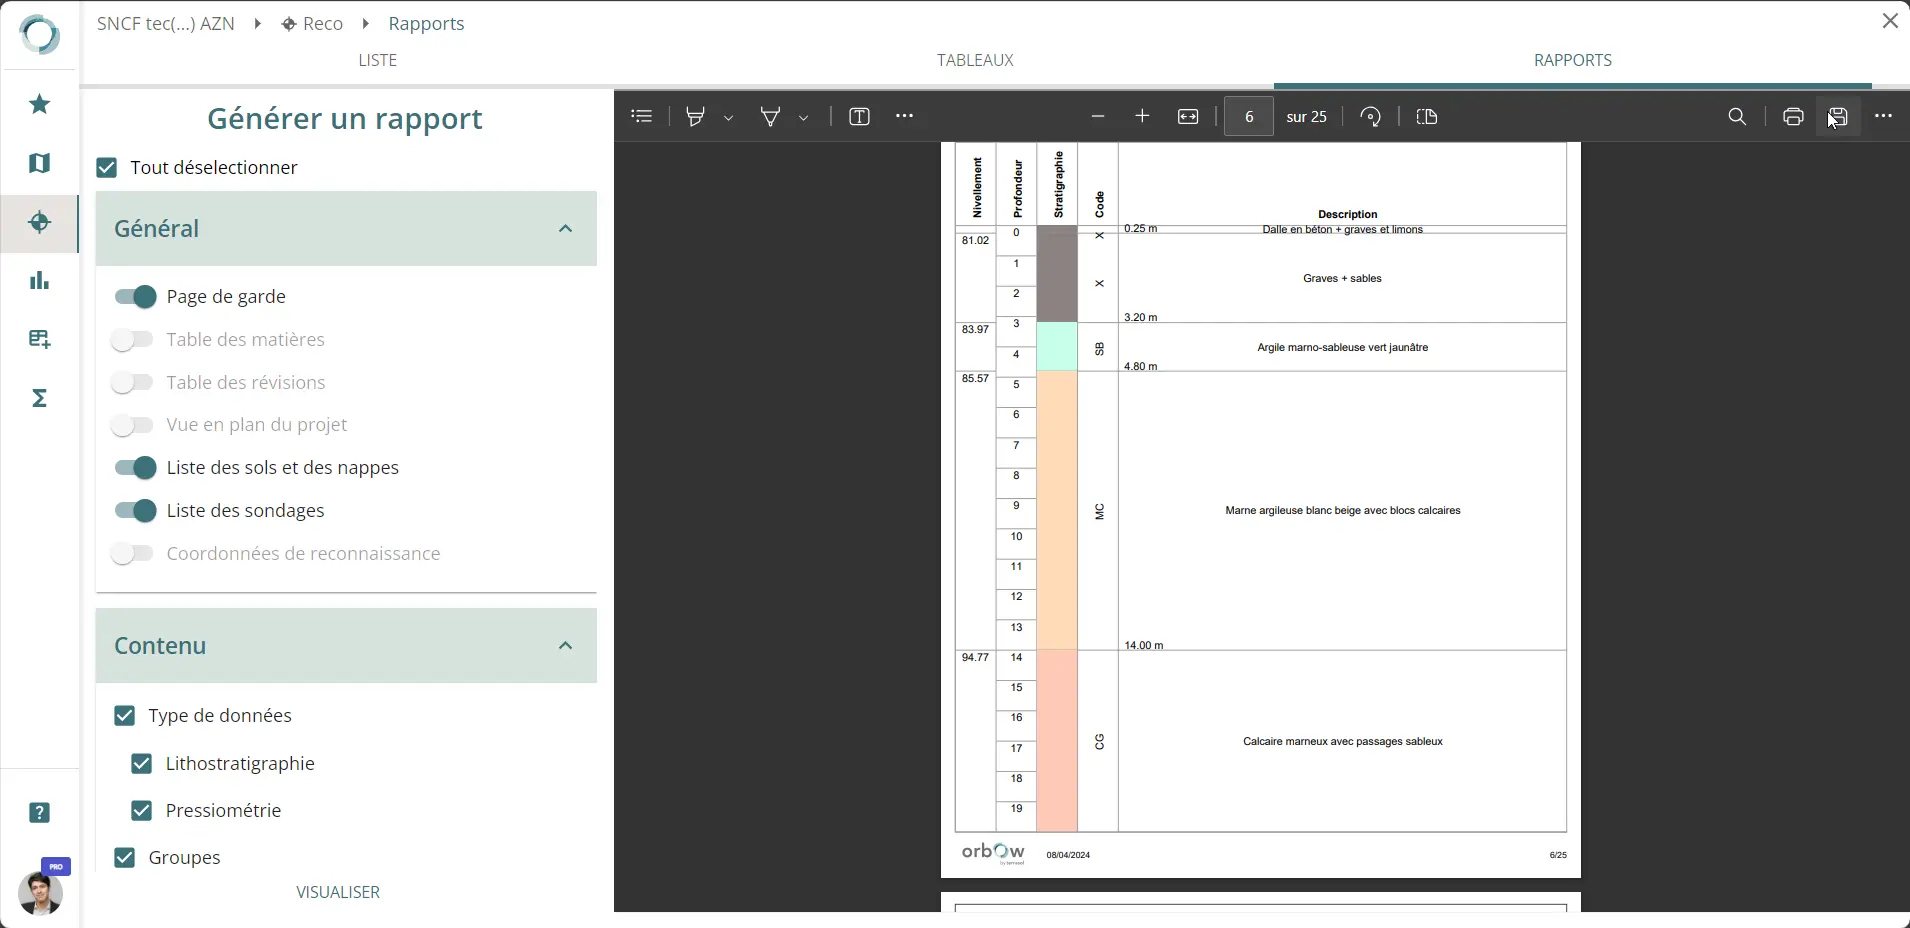
All you have to do is select the data types you want to add to your report, and the survey groups you want to integrate. Click on "View", and the report will take a few moments to generate.
Coming soon
For the moment, only the borehole log and the pressuremeter test graph are available. Other types of data will be added progressively.