Analysis tools
This section describes the general principles of Orbow's analysis functions. The modules are described individually in tools.
Create cases and add modules
The OAD module for "Decision Support Tools" provides access to a library of support modules for context analysis and investigations.
In particular, it includes modules for statistical analysis and for creating longitudinal profiles and soil cross-sections.
This module is accessed via the icon on the taskbar: 
Clicking on the icon opens a side panel.
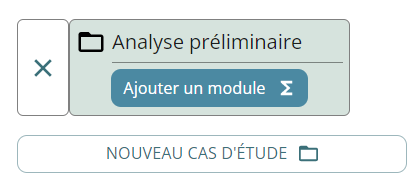
To begin creating analyses, start by creating a case study, a sort of storage folder for the analyses you are going to perform in this brick, using the dedicated button.
A block is created, which you can rename, and a button for adding a module is present in this block.
This button opens a second panel listing the modules in the library. Just click on a module to add it to your case study:
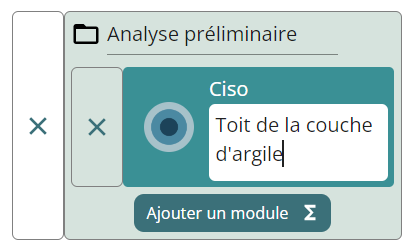
You can add several modules at once, or even add the same module several times by clicking as many times as you like on its label.
The labels with a ✖️ that fold out to the left of the module or case study block buttons allow you to delete one or the other respectively.
To enter the interface of an analysis module, simply click on its icon.
For your information
When you edit the input data in a module that you have added to your project and opened, the data is automatically saved.
The interface shows you that the save has been taken into account with a message like this:

However, data saving is only available when the module is being used as part of a project.
All data entered will be automatically saved for future use.
However, data will not be saved when a module is used in sandbox mode. If you are using the module in sandbox mode, where data is not saved automatically, the Import ("General" tab) / Export ("Calculation" tab) mode may be useful. You can import and export project data from Excel or json files. This allows you to save your calculation files locally and re-import them later if necessary.
Coming soon
A module may take a few seconds to load. In some cases, if you start editing too quickly when the module is not yet fully launched, the backup may miss what you have just entered.
This behaviour will be improved in the future.
General module interface
The various modules of the Orbow application all have the same layout:
- On the left, the input tabs, which are generally made up of three tabs: General, Data and Calculation. These tabs are described in detail in Input tabs.
- On the right, the graphics and results tables area, which comprises two tabs: Model and Results. These tabs are described in detail in Output tabs.
- The size of the two areas can be adjusted by clicking on the vertical bar between the two areas. You can also make a panel full screen by using the 'frame' icon at the top right of each panel.
Input tabs
The "Input tabs" area generally consists of three tabs: General, Data and Calculation. The content of each of these tabs is specific to the module and is used to enter the information required for the calculation.
"General" tab
In the "General" tab, you can enter the "Calculation title" to identify your calculation (in this case, the analysis).
This title is synchronized with the fold-out page listing the analyses added to the project.
Under the "Calculation title" field, you'll find an import button for importing a project from a pre-filled file in Excel or json format. To import from an Excel file, use the template to download via the dedicated button.
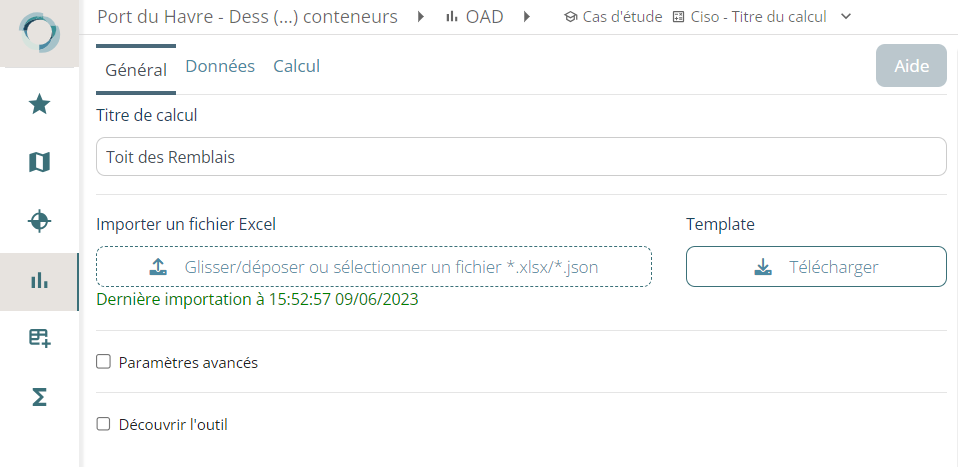
In some modules, you may have to enter advanced or additional parameters, located below the import box. These advanced parameters allow you to further customise the calculation according to your specific needs.
Finally, at the end of the "General" tab, you will find a box entitled "Discover the tool". By clicking on the checkbox, you can import an example project to test and better understand how the tool works. It is important to note that importing an example project will delete your current project.
"Data" tab or tab bearing the name of a specific calculation mode
The "Data" tab is an essential part of entering calculation parameters. It is subdivided into several sub-tabs, which differ from one module to another depending on the specific features of each module.
Each sub-tab corresponds to a specific category of data to be entered. The data required may vary depending on the type of calculation and the specific needs of the module selected. It is essential to enter the data correctly in order to be able to run the calculation and obtain reliable results.
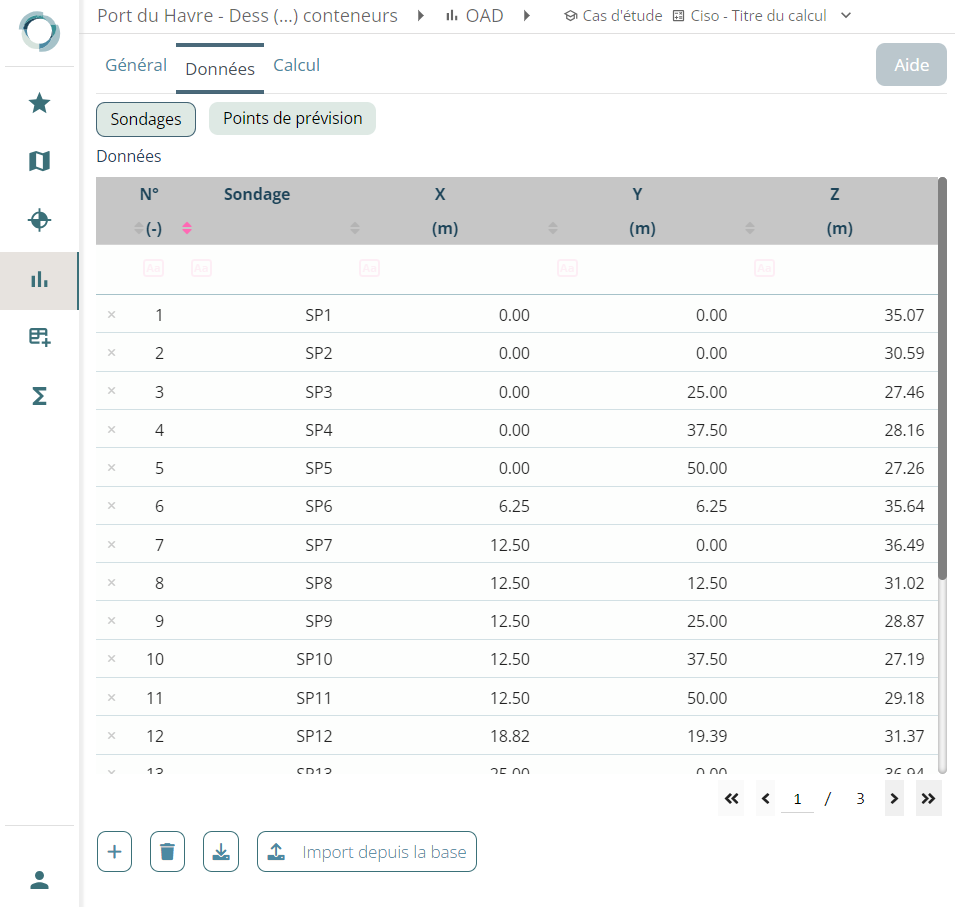
When errors are detected in the data entered, warning messages are displayed in the top right-hand corner. These messages indicate the problems identified and allow you to correct them before proceeding with the calculation. It is important to heed these warning messages and ensure that all data is entered correctly.
"Calculation" tab
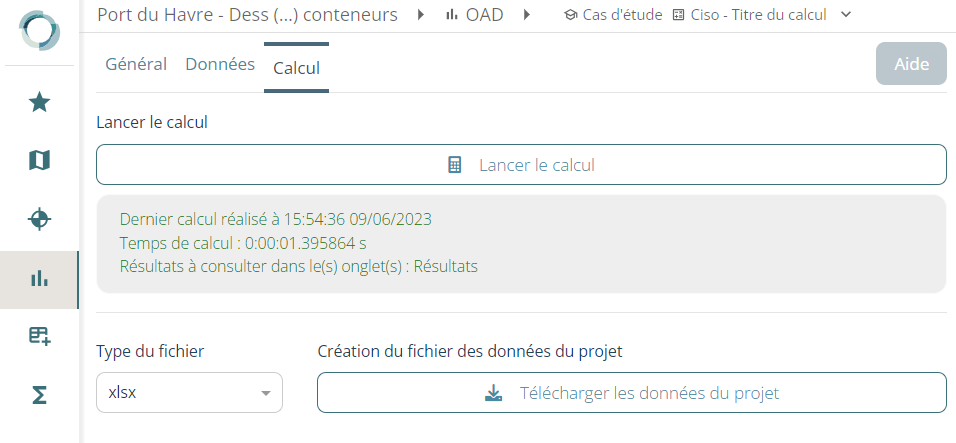
In the "Calculation" tab, the " Start calculation" button is accessible only when all the necessary data has been correctly entered. Its role is to launch the calculation on the remote calculation server using the parameters entered.
Below the " Start calculation " button, a dedicated field allows you to view the progress of the calculation. A notification will appear once the calculation has been completed.
In most modules, a "Download project data" button is also available. This button allows you to download and store locally the data file entered in this module in Excel or json format, making it easier to archive or re-use at a later date. In fact, it can be reimported using the import button on the 'General' tab.
Output tabs
The "Output tabs" area consists of two main tabs: "Model" and "Results". The "Results" tab is sometimes given a different name, particularly if the module contains several different calculation modes.
It is important to note that the information presented in the tabs of the "Output tabs" frame depends on the specific module used. Each module may have its own specific results and displays.
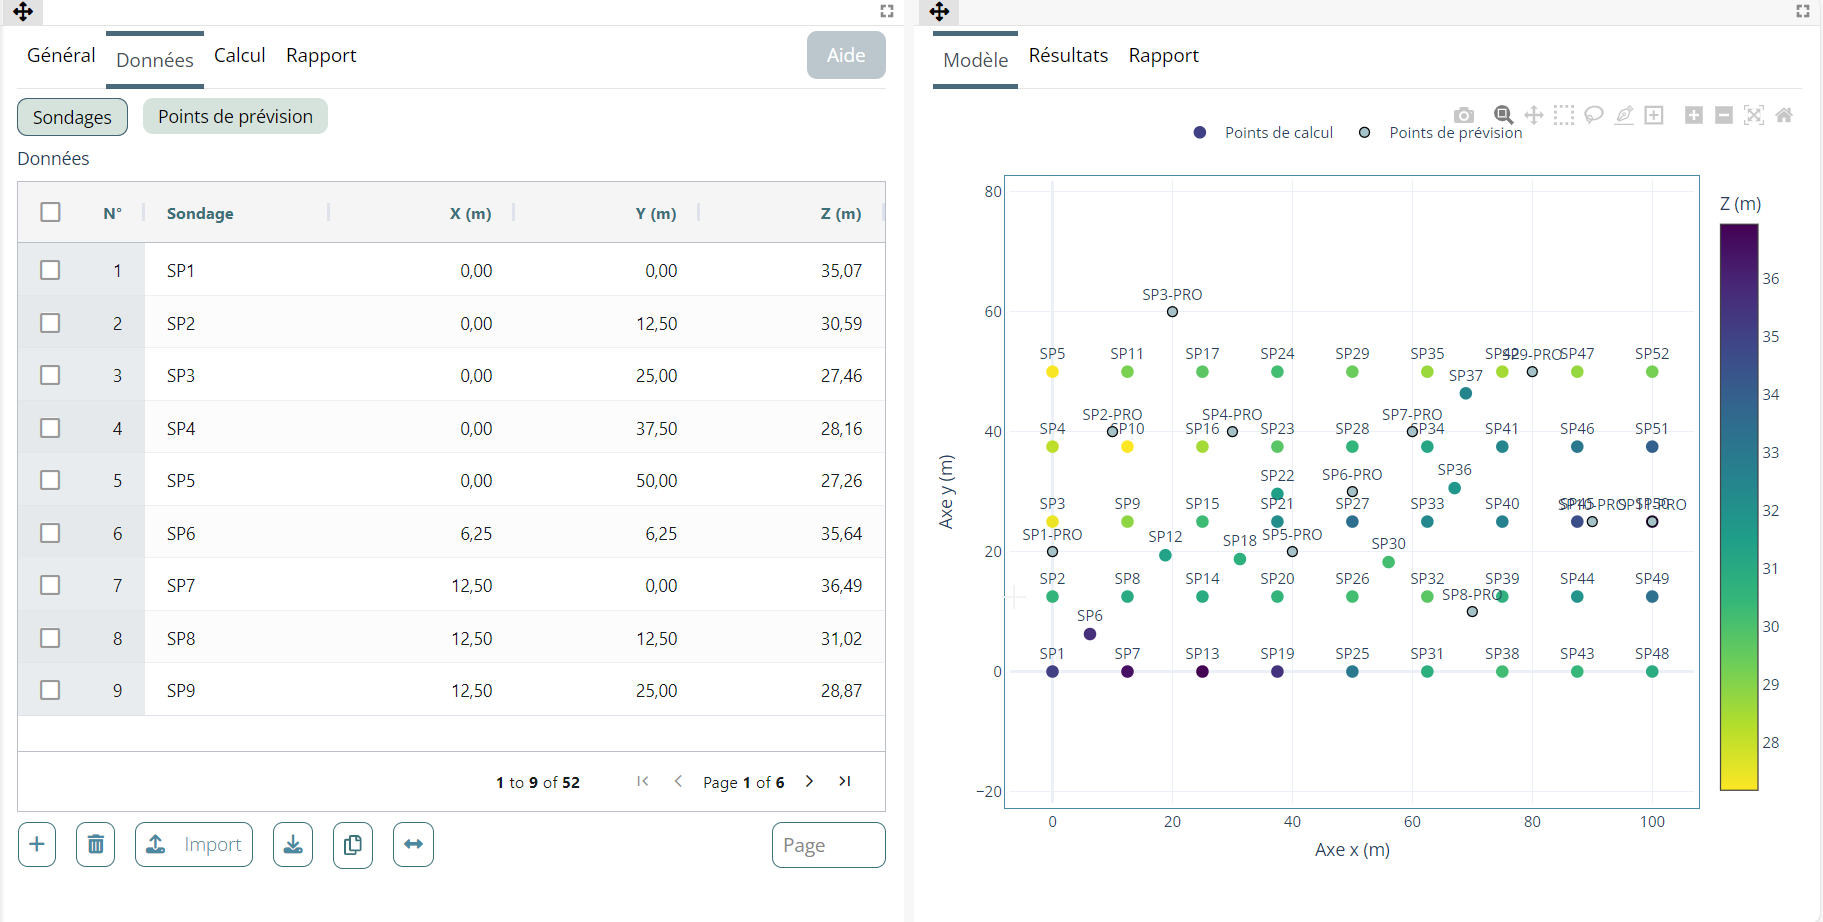
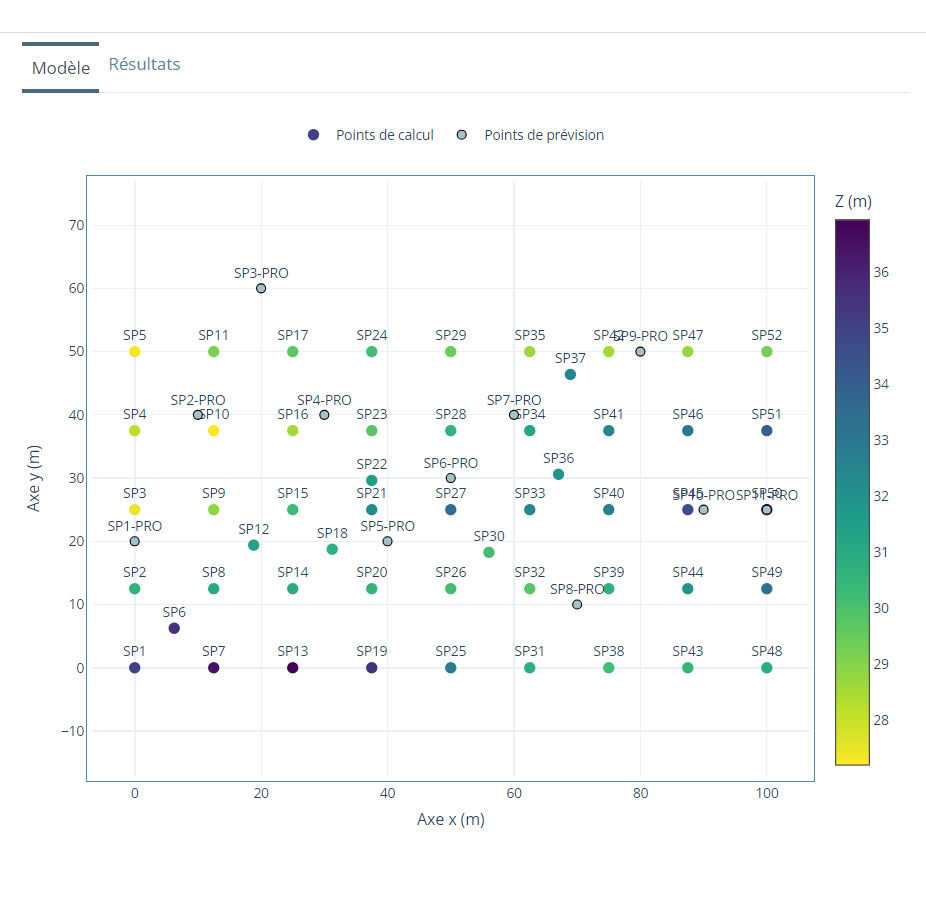
"Model" tab
The 'Model' tab displays graphs based on the data entered, without interpretation. These graphs provide a visualisation of the input data. They are interactive, meaning that they can be explored and manipulated to better understand the relationships between the different data. In addition, these graphs are automatically updated when changes are made to the input data.
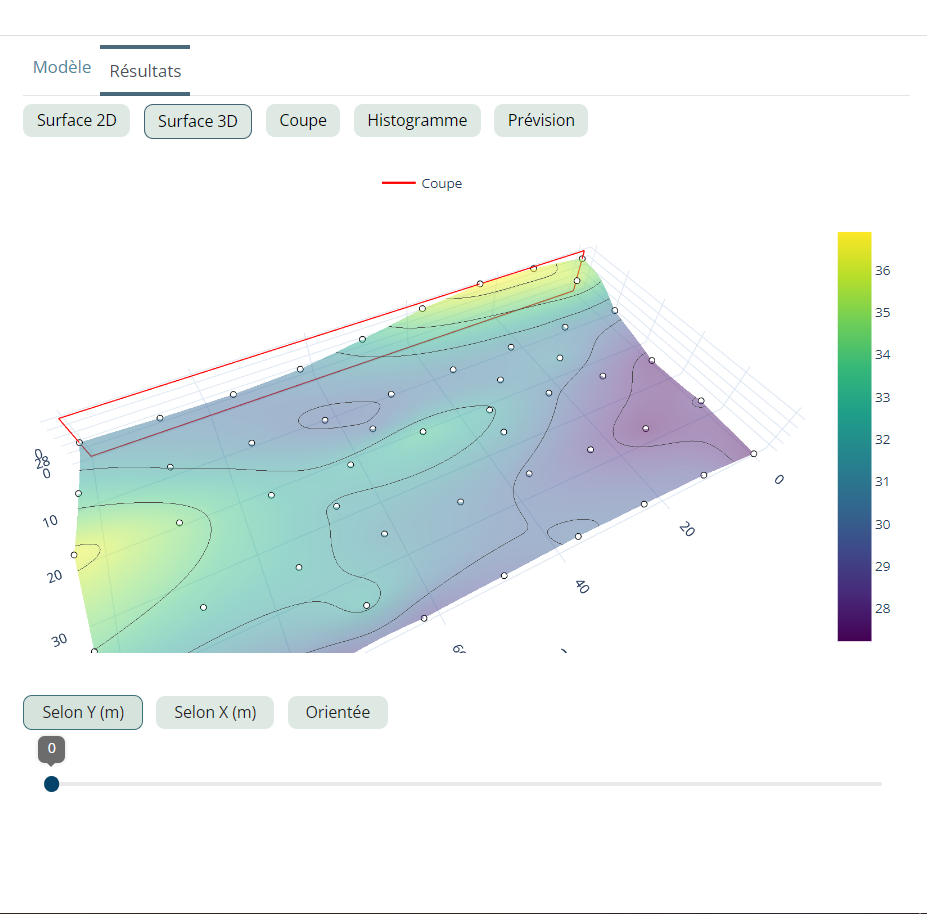
"Results" tab
The "Results" tab contains the calculation results obtained after running the calculation. The results may include tables, graphs (curves, diagrams) or other relevant information specific to the module used.